Project: Autoencoder Visualization for Fraud Detection
Description
 Problem
In a previous project, Baker Tilly created an autoencoder to detect fraudulent transactions in a list of transactions. The autoencoder shows good results for the anomaly detection problem. However, it is difficult to show why the model made certain decisions and why it found some fraudulent transactions while it didn’t find others.
Thus, the model acts like a black-box, and the only output that it gives to the accounts is a risk score for each transaction to indicate if it has a high chance of being a case of fraud or not. Since the model cannot explain itself to the accountant, the results are difficult to be trusted and the risky transactions are difficult to further investigate.
Challenge
The challenge lies in explaining the decision-making process autoencoder. The visualizations that will be used should explain to the accountants why they should further investigate a certain transaction within a company. At the same time, the visualization should give the accountant the confidence that the autoencoder found most of all the fraudulent transactions.
Another challenge will be the model. The employee that made the autoencoder mentioned that there were some problems with the model, and she advised me to take a look at certain issues during the thesis. For instance, she didn’t use enough/different data and she did some pre-processing and assumptions on the training data.
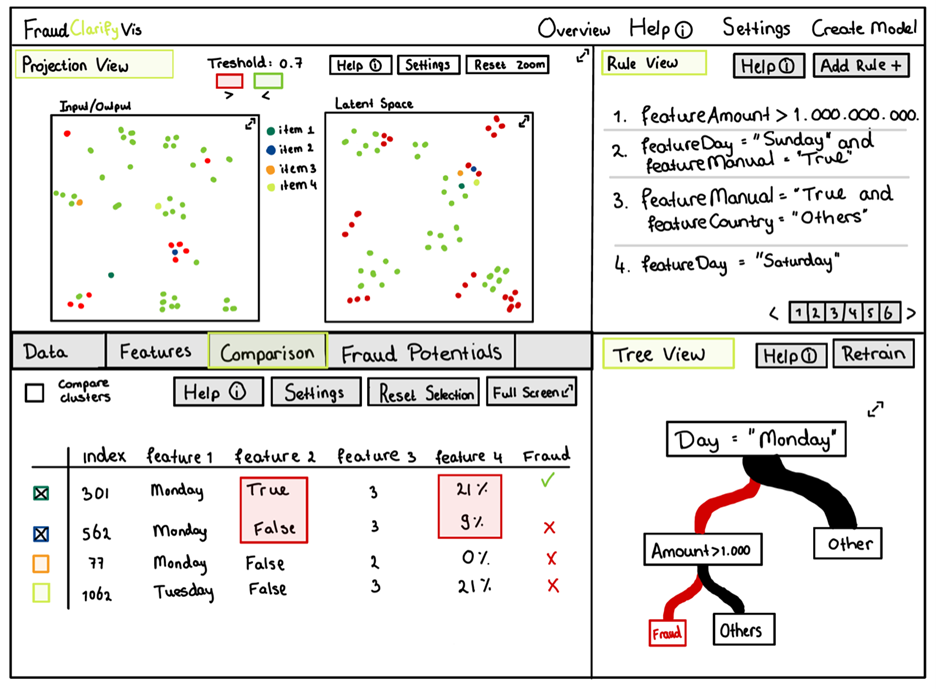
Possible SolutionThe solution will be a dashboard that uses multiple visualizations to explain the decision-making process to the accountant.
Details
- Student
-
 Martijn Noordhof
- Supervisor
-
 Stef van den Elzen
- Secondary supervisor
-
JEJan-Willem van Essen (Baker Tilly)
- External location
- Baker Tilly
- Link
- Thesis