Project: Visualization of Event Sequence Data
Description
Master project with Sanne van der Linden.
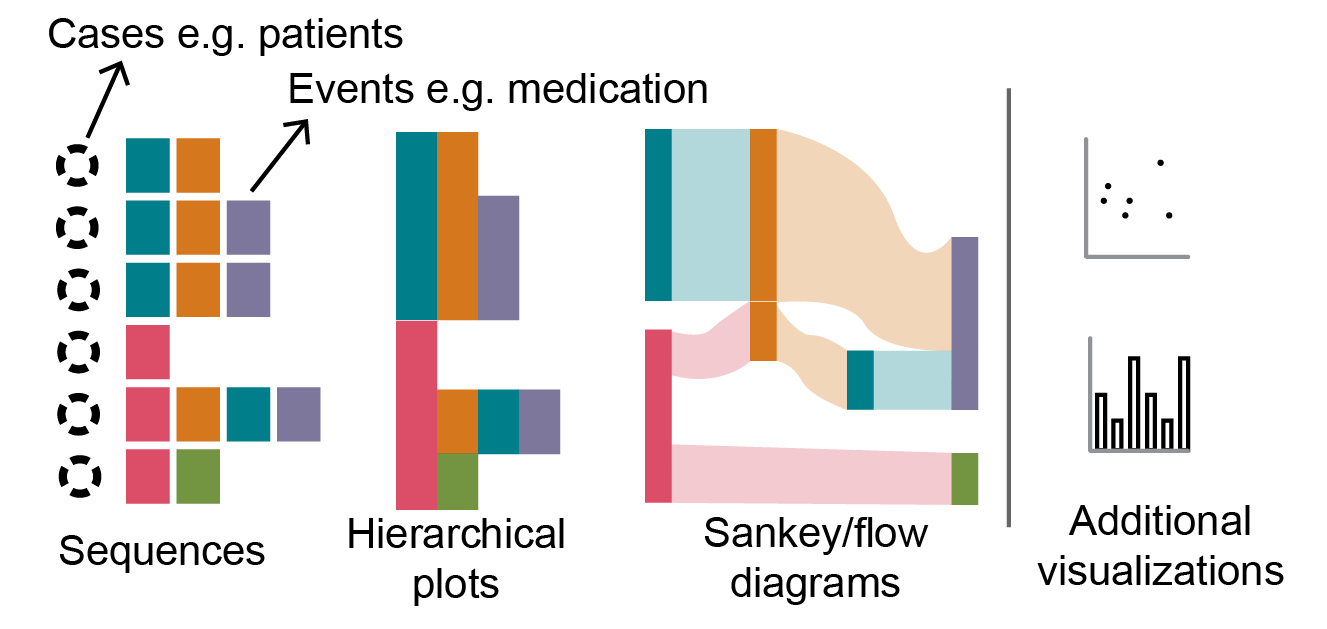
I am a PhD candidate and my research topic is about event sequence data. Much of the collected data is multivariate sequential data from heterogeneous data sources, such as patient treatments and medication in healthcare or customer behavior of websites. Multivariate event sequences are discrete records of a state with multiple attributes that form a chronologically ordered sequence. For example, consider the medication intake of a patient. In this example, each medication intake is a discrete event. Each medication event has multiple attributes (multivariate), e.g. the doctor administering the medication and the location of the patient. All these events form a sequences of the medication intake per patient. This is only a simple example with two attributes, but in reality there can be tenths or hundreds of attributes. Often general patterns can be discovered in these sequences, but also the details are needed to get a complete picture of the situation. The question is how to analyze and compare all these multivariate events and event sequences. I believe only using automatic algorithms or methods do not provide optimal solutions, because the domain knowledge of the user is not taken into account, the results are often aggregated and the context is lost. Also, exploration of the data set without having specific queries in mind is often not supported and events need to have some level of importance to differentiate between them. Often, these data set are rather big, so scalability also needs to be taken into account.
Therefore, my PhD focuses on analyzing these multivariate event sequences using an integration of interactive visualizations, algorithms support and interactivity; a visual analytic approach. The main research question addressed in this PhD is:
"How to enable people to obtain insight in dynamic multivariate case data using a combination of automated and interactive visual methods?"
So overall, I try to enable users to understand multivariate event data interactively by using automated methods, such as machine learning, to make them understand their data.
Details
- Supervisor
-
 Sanne van der Linden