Project: Data-driven Archive Visualization
Description

Digitization of archives is an ongoing process in which the books in archives are handled in some order. The partial availability of the digitized records poses a problem for both volunteer, researcher and manager. All of them are left in a state in which they have no clear view what has been digitized. Such a view could be on the level of an archive, book, time-period, municipality, etcetera.
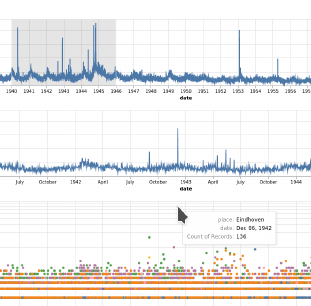
Using the digitized records as data this problem can be mitigated by designing and implementing an interactive visualization tool. Using this data also opens the door for additional visualizations. For instance, simply showing frequency counts of record types per day, might reveal interesting information that could trigger professional curiosity of archive researchers. Apart from the obvious patterns there might be more hidden patterns in the data that with a suitable interactive (statistical) analysis might come to light.
Detailed description
View PDFDetails
- Student
-
JLJeroen 't Lam
- Supervisor
-
 Huub van de Wetering