Project: Random Forest Interpretation through Representative Trees
Description
The Random Forest model is an effective ensemble machine learning model that can be used to achieve high predictive accuracy. It consists of multiple decision tree models, each trained on a smaller part of the original data. However, its inherent complexity makes it difficult to interpret and explain the predicted outcome to stakeholders. This prevents such models from being used in high-stakes decision making, in which is remains essential that decisions made using machine learning predictions can be justified.
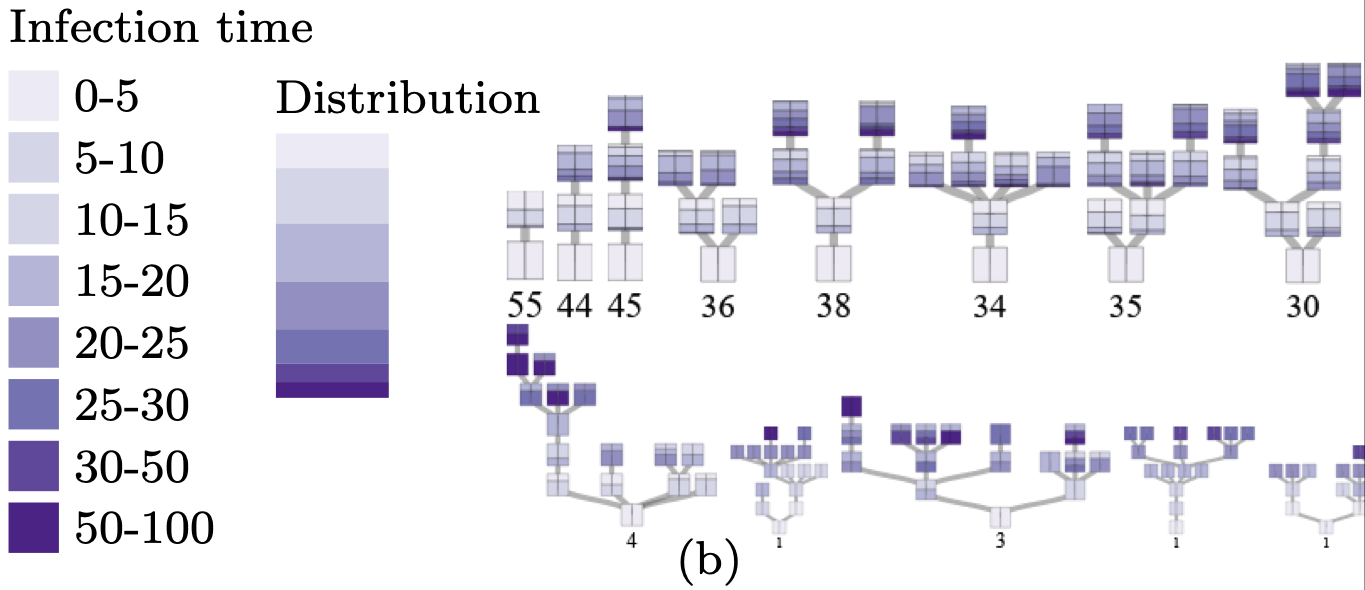
This project aims to provide insights into these complex models through the visualization of prototypical subgroups of trees. By finding one or more representative trees that describe a subset of the full model, the size of the model to be interpreted may be reduced significantly. This approach has already demonstrated to be effective in the case of epidemiological transmission trees [1], and we think this approach would work well for the case of random forest interpretation.
Combined with the state-of-the-art in tree visualization, representative trees can provide a comprehensive explanation of the complex model. Next, by controlling the granularity of clustering we can tailor the explanation (i.e., level of detail) for different audiences: data scientists typically require more detail, whereas decision makers may prefer a simpler but less accurate explanation.
Challenges include how to effectively cluster decision tree models (i.e., a comparison and evaluation of different distance metrics between trees for the purpose of clustering), how to (visually) convey the uncertainty or lost details when summarizing a large set of trees with a single representative tree, how to support the end-user in choosing the appropriate level of detail, and what is the most effective visual representation of a set of decision trees.
References
[1] Sondag, M., Turkay, C., Xu, K., Matthews, L., Mohr, S., & Archambault, D. (2022, June). Visual analytics of contact tracing policy simulations during an emergency response. In Computer Graphics Forum (Vol. 41, No. 3, pp. 29-41).
Details
- Student
-
 Sem Lommers
- Supervisor
-
 Stef van den Elzen
- Secondary supervisor
-
 Dennis Collaris
- Link
- Thesis