Project: Going from raw data to meaningful and personalized multivariate events
Description

Discrete
multivariate event sequences are discrete records of a state with multiple
attributes that form a chronologically ordered sequence. Discrete multivariate
event sequences can be found in domains ranging from healthcare to
transportation. Nevertheless, generating and analyzing such sequences from
existing data is not straightforward, requiring visual-based human
intervention, such as visual analytics systems, to aid in this process. For
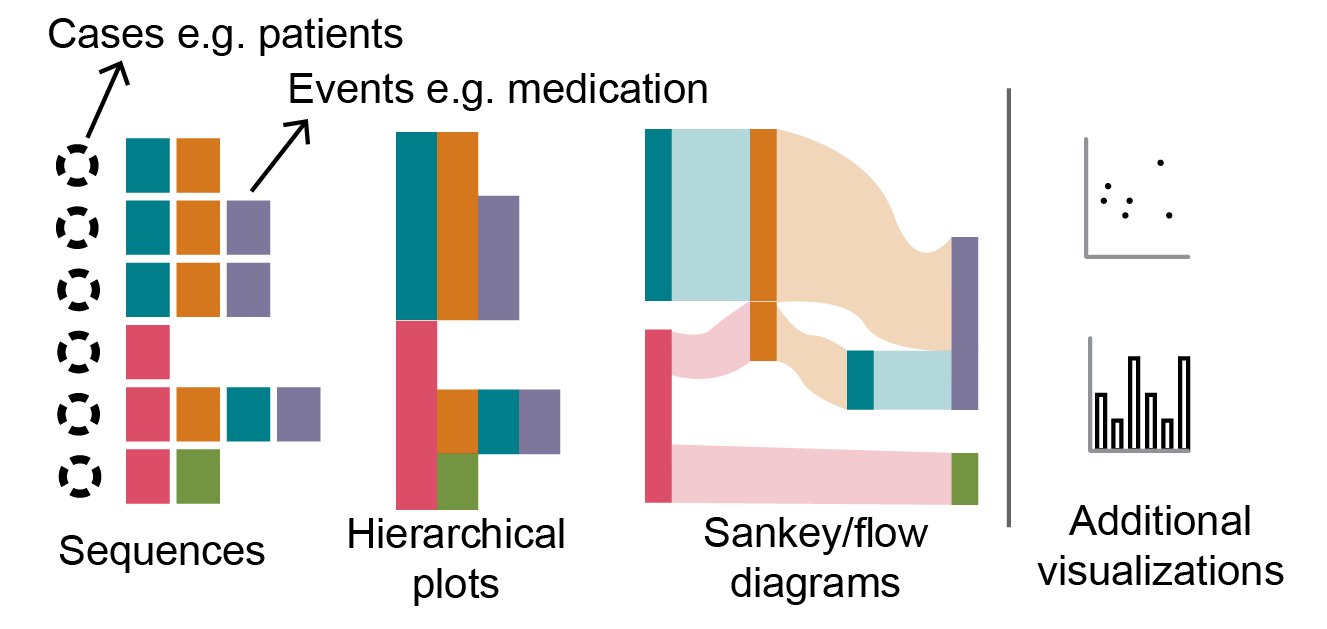
example, consider the medication intake of a patient. In this example, each
medication intake is a discrete event. Each medication event has multiple
attributes (multivariate), e.g. the doctor administering the medication and the
patient's location. All these events form sequences of the medication intake
per patient. In reality, it is sometimes unclear how to make these multivariate
events from the raw data or compress the raw data to custom multivariate events
based on the user's domain knowledge. For example, besides medication, the
heart rate is also measured. How could one meaningfully combine these two
variables to make multivariate events? Users may want events when a high heart
rate is combined with specific medication values. In order to find these
correlations or co-occurrences, users need help from visual analytics systems.
In this project, you may use knowledge graphs to see if this shows these
correlations and co-occurrences to go from raw event data to meaningful and
personalized events. This master project involves four people; Fernando Paulovich, Stef van den Elzen, Leo Milhomem Franco Christino, and Sanne van der Linden.
Details
- Student
-
RLRianne van der Leeuw
- Supervisor
-
 Fernando Paulovich
- Secondary supervisor
-
 Stef van den Elzen