Project: Visualization of CathLab data
Description
Coronary artery disease is one of the most common heart diseases. The coronary arteries are the main heart vessels supplying oxygenated blood to the heart. When diseased, these arteries are clogged in certain locations, which we refer to as stenoses. To treat these stenoses, Percutaneous Coronary Interventions are performed by which a stent is placed in the coronary arteries to remove the clogging.
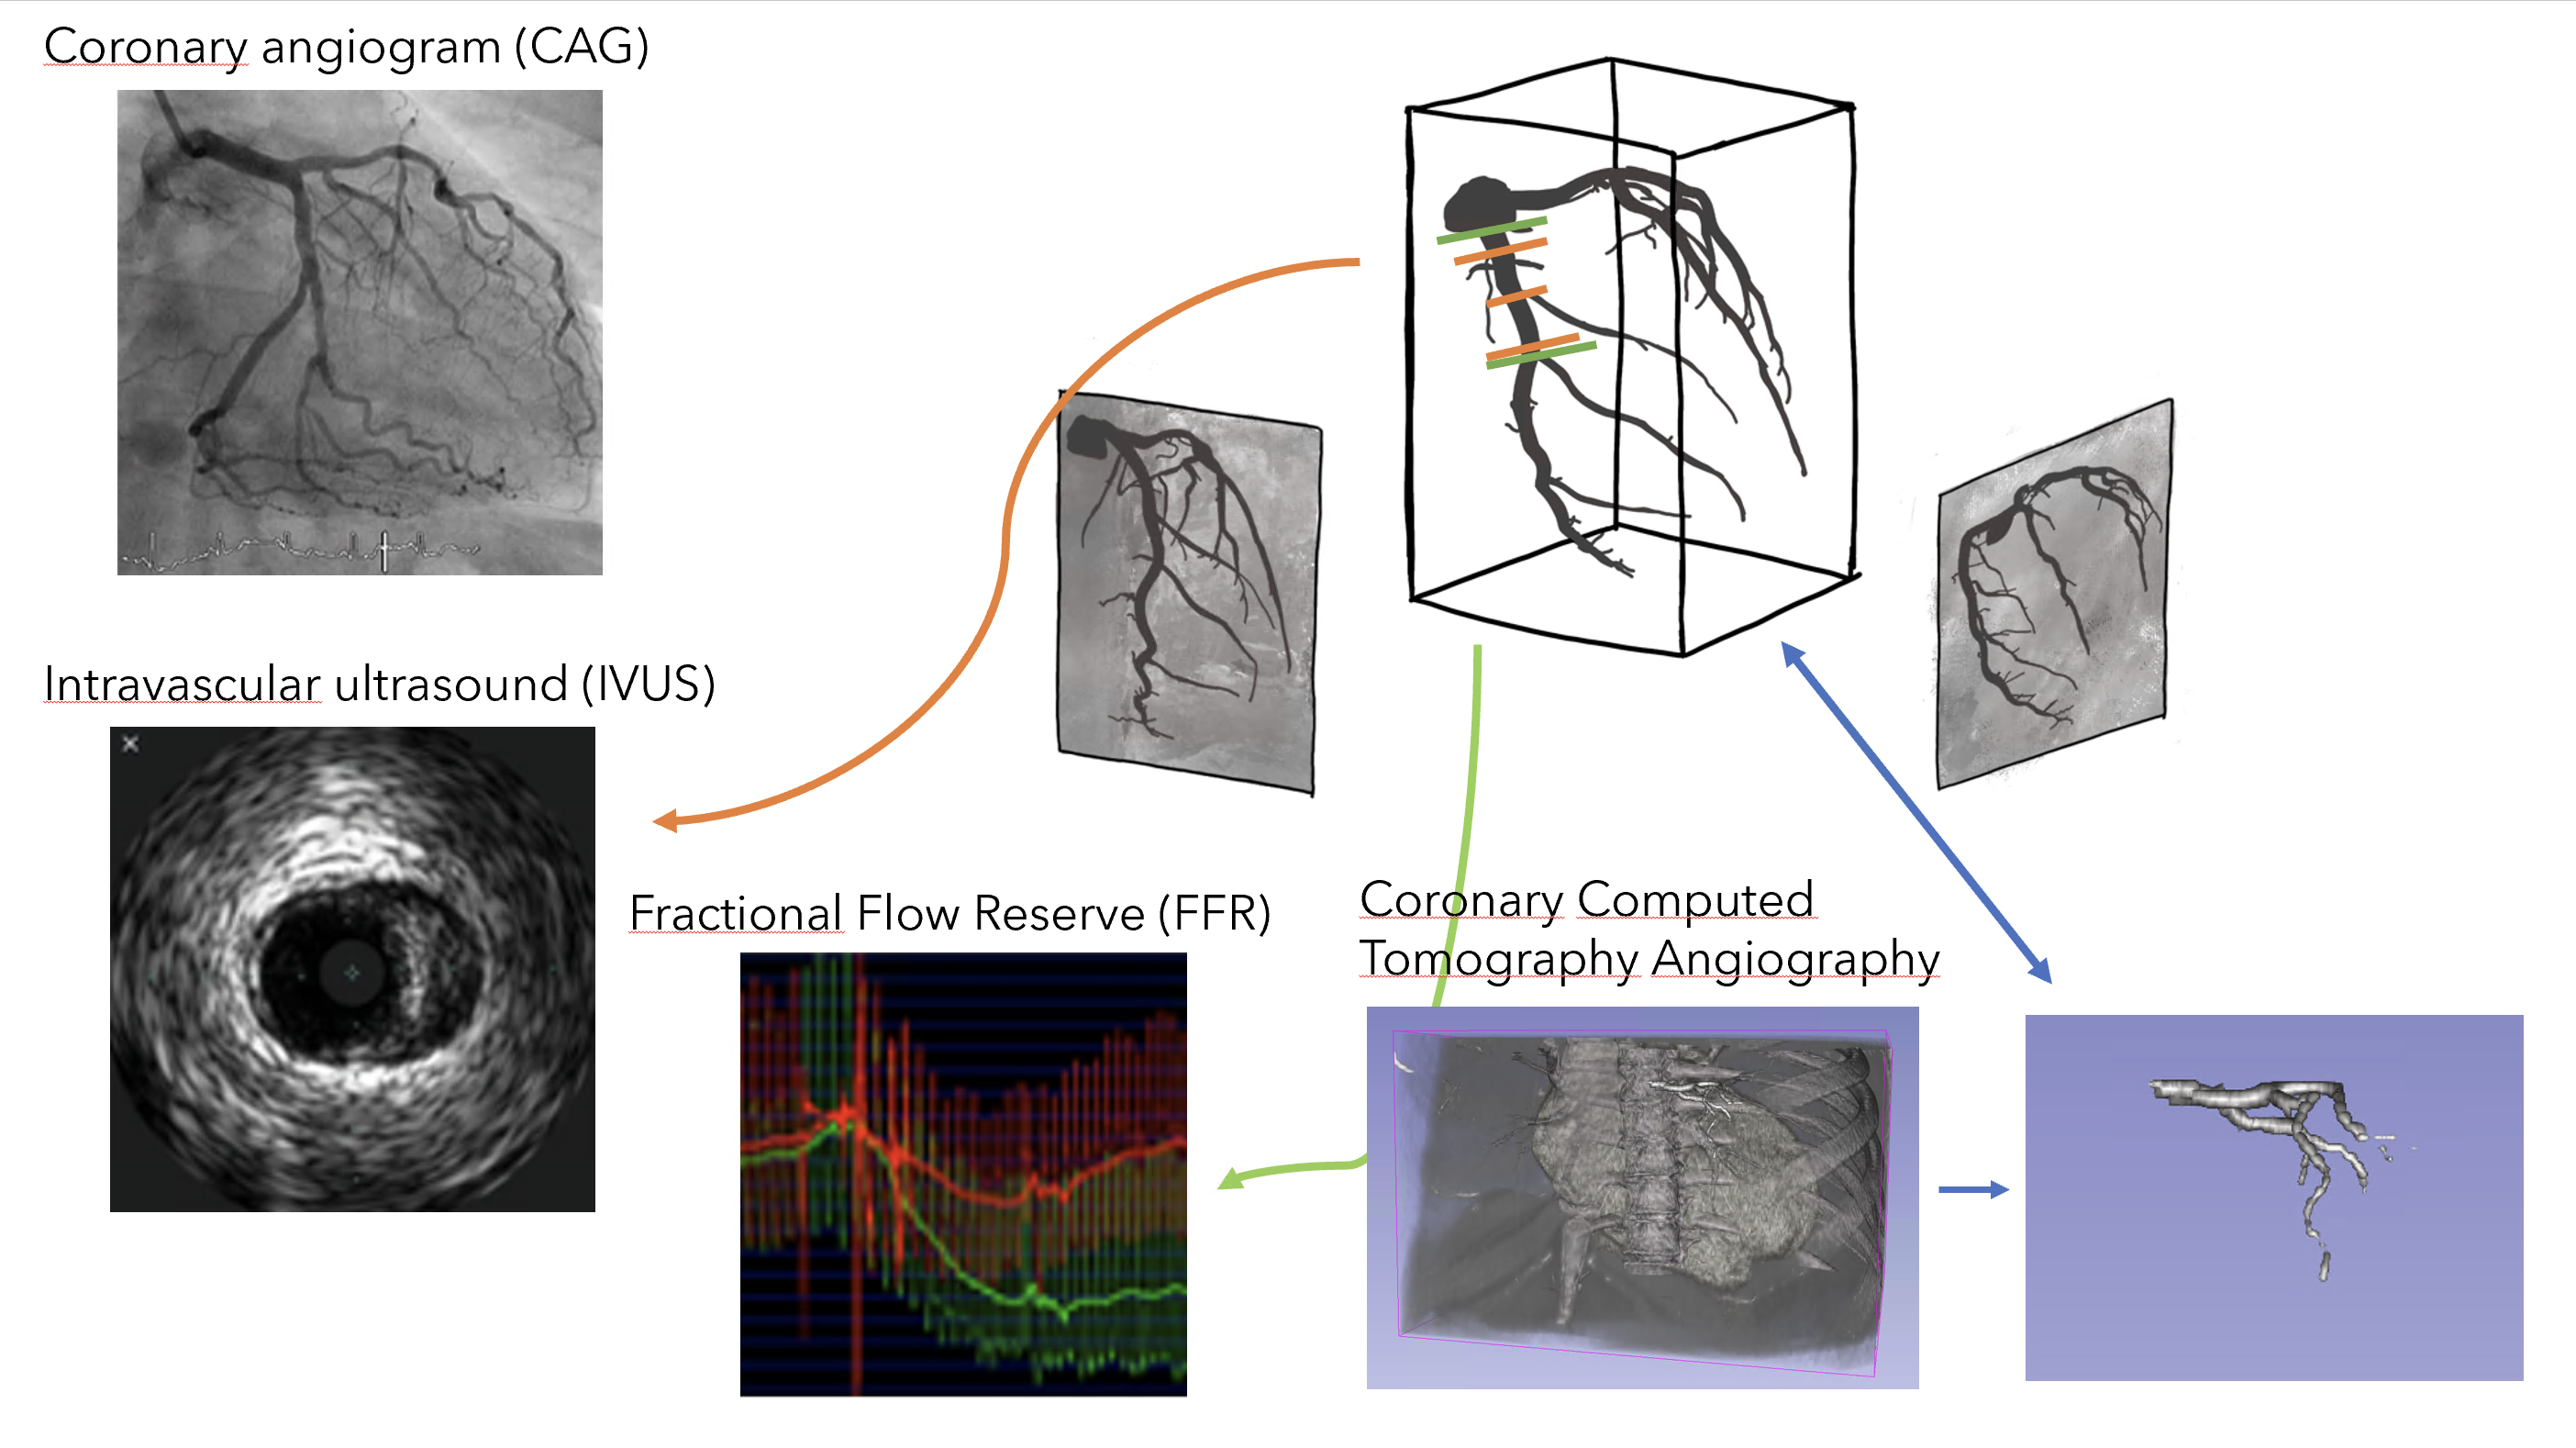
To diagnose and treat patients with coronary artery disease, several medical data sources are collected in the Catherization Lab (CathLab), either in the form of images or measurements. Each of these data sources has its advantages and disadvantages. For example, X-ray coronary angiograms (CAG) provide details on the tree-structure of the coronary arteries and stenoses but lack information due to the 2D view of the 3D object. On the other hand, intravascular ultrasound (IVUS) provides detailed information on the severity of the stenosis from the inside of the vessel but is time-consuming to perform in practice for the whole coronary artery tree.
Although a rich amount of data exists per patient, this data is typically not fully exploited due to the lack of synchronization. For example, stenoses may be visible in both CAG and IVUS, but the location of these measurements across the coronary artery are not synchronized. As a result, a large amount of manual work needs to be performed by medical researchers to compare the data sources accurately.
Visualization techniques and interactions that combine the different data sources in an intuitive way could aid medical researchers and physicians. For example, the comparison across data sources could be aided with image- or surface-based visualization techniques [2, 3, 4, 5]. One specific example of that is an interactive matching of the locations of the IVUS data with the structure visible in the CAG images [1, 4, 5]. Lastly, multiple patient data sources could be compared to perform a comprehensive study to identify trends and patterns in groups of patients [6].
This project is in collaboration with Catharina Ziekenhuis Eindhoven (CZE). You will work with medical researchers, so we expect you to have good communication skills and an eagerness to learn about the biomedical side of the data. We also expect you to have a good understanding of programming as well as image processing, as you will be implementing complex 3D visualizations while combining image data sources. Lastly, we would like you to have basic understanding of visualization.
References
[1] Wu, W., Samant, S., de Zwart, G., Zhao, S., Khan, B., Ahmad, M., ... & Chatzizisis, Y. S. (2020). 3D reconstruction of coronary artery bifurcations from coronary angiography and optical coherence tomography: feasibility, validation, and reproducibility. Scientific reports, 10(1), 18049.
[2] Borkin, M., Gajos, K., Peters, A., Mitsouras, D., Melchionna, S., Rybicki, F., ... & Pfister, H. (2011). Evaluation of artery visualizations for heart disease diagnosis. IEEE transactions on visualization and computer graphics, 17(12), 2479-2488.
[3] Eulzer, P., Meuschke, M., Mistelbauer, G., & Lawonn, K. (2022, June). Vessel Maps: A Survey of Map‐Like Visualizations of the Cardiovascular System. In Computer Graphics Forum (Vol. 41, No. 3, pp. 645-673).
[4] Xiong, G., Sun, P., Zhou, H., Ha, S., ó Hartaigh, B., Truong, Q. A., & Min, J. K. (2016). Comprehensive modeling and visualization of cardiac anatomy and physiology from CT imaging and computer simulations. IEEE Transactions on Visualization and Computer Graphics, 23(2), 1014-1028.
[5] Oeltze, S., Kuß, A., Grothues, F., Hennemuth, A., & Preim, B. (2006, January). Integrated visualization of morphologic and perfusion data for the analysis of coronary artery disease. In EuroVis (pp. 131-138).
[6] Meuschke, M., Niemann, U., Behrendt, B., Gutberlet, M., Preim, B., & Lawonn, K. (2021). GUCCI-guided cardiac cohort investigation of blood flow data. IEEE Transactions on Visualization and Computer Graphics.
Details
- Student
-
 Sjoerd Koop
- Supervisor
-
 Anna Vilanova
- Secondary supervisor
-
KVKirsten Maas, Amy Vermeer (CZE)