Project: Using Knowledge Graphs and Visualization to Support the Comparison and Combination of Code-based Data Analytical Solutions
Description

Any data analytical problem has multiple ways to be solved, involving different data mining, machine learning, or visualization solutions used in various combinations and orders. One example is the Kaggle competitions (https://www.kaggle.com/competitions), where a problem is posted, and the community contributes with different code-based solutions, which are then ranked according to their success. In this multitude of solutions, various questions may emerge. For instance, why is the solution A better than B? How can I compare them? Or is it possible to combine solutions?
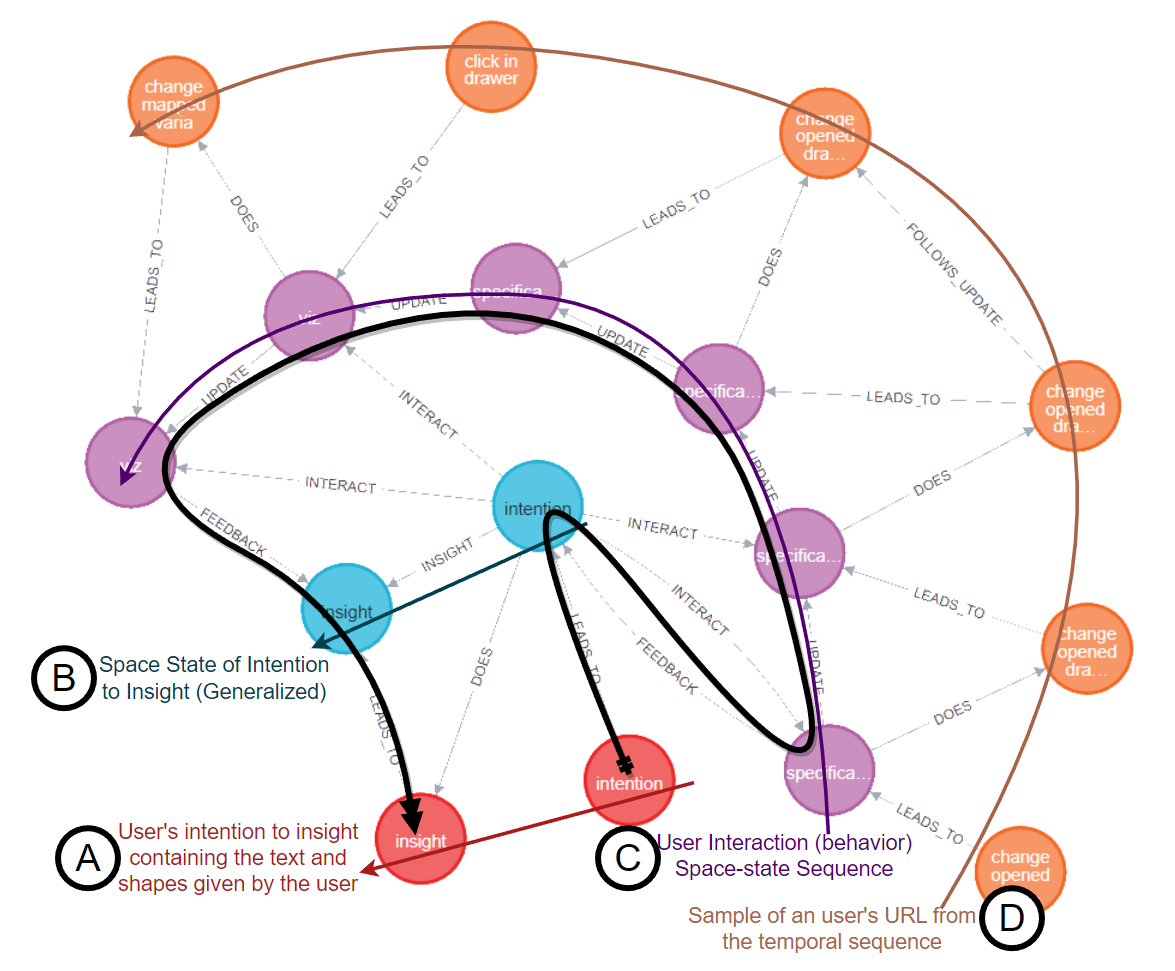
This project aims to address this challenging problem by combining text (code) processing, knowledge graphs, LLMs, and visualization, focusing on modeling the structure of different solutions and then visualizing such structures using some (semi)automatic and intelligent approach to guide users in this process.
Details
- Student
-
MGMarlou Gielen
- Supervisor
-
 Fernando Paulovich
- Secondary supervisor
-
 Leonardo Christino