Project: Visualization for troubleshooting CSV files
Description
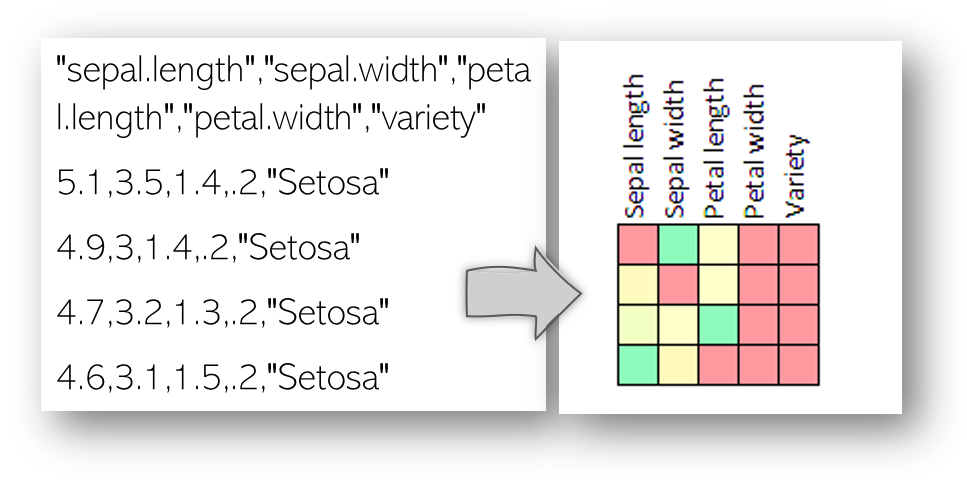
A
Comma Separated Values (CSV) file is a plain text file that contains rows of
data values (see Figure). These files are typically used to load into
visualization and machine learning tools.
It
often happens that the CSV file is not correctly structured. For example, there
might be more values then are specified in the header. Or there are unexpected
line-breaks, non-conforming data types, attribute names not on the first line,
unescaped use of commas. It could also be that there are unacceptable
characters such as text in a numbers-only column or numbers in a Boolean
column.
If
this is the case, then loading it into the visualization or machine learning
tool for analysis fails. These errors then first have to be fixed manually.
Minimizing CSV import errors can be a time consuming, laborious process. Therefore,
tools like data wrangler have been developed [1]. However, it relies on the
user writing scripts to repair the data file. In this project we explore if it
can be done in a more visual way, by directly visualizing each value of the
data file as a colored pixel for example (see Figure). This gives the user an
overview of where there might be errors in the CSV file. Then with interaction
the user should be enabled to easily repair the errors. Note that the CSV files
might be really big, so scalability should be taken into account.
Requirements
- Good programming skills
- Visualization background
References
[1]
Wrangler: Interactive Visual
Specification of Data Transformation Scripts Sean
Kandel, Andreas Paepcke, Joseph
Hellerstein, Jeffrey Heer ACM
Human Factors in Computing Systems (CHI), 2011
Details
- Student
-
OAOula Osman Abou
- Supervisor
-
 Stef van den Elzen