Project: Dynamic Graph Visualization using Matrices
Description

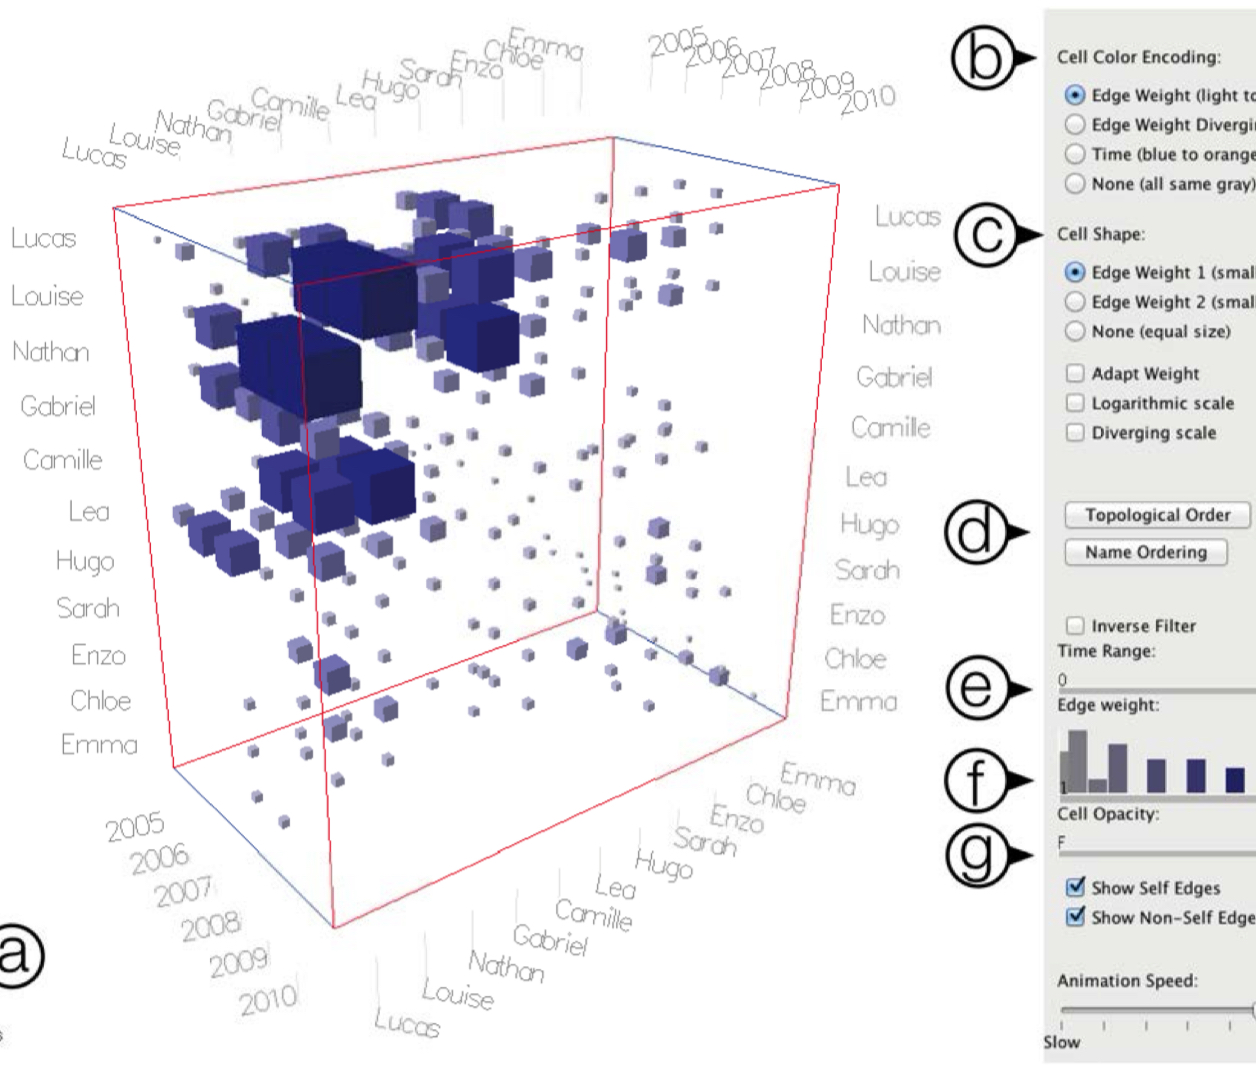
The use of adjacency matrices in network visualization is justified by a several reasons: they do not suffer from clutter (as in node-link diagrams for example), and allow to quickly identify groups and structures with practically no adverse effects when scaling to larger networks. While extensive research has been done on the visualization of static graphs using this technique, the same cannot be said for dynamic graphs. This can be due to several reasons. One of which is the problem of reordering: to be the most effective, rows and columns need to be reordered so that the before mentioned structures "emerge" from the representation. Matrix reordering, however, can be time consuming, and having to re-compute it at every time step might be a difficult way to follow. Moreover, changing the ordering might be distracting or misleading for the user, and therefore appropriate techniques for mental map preservation might be used to mitigate this problem.
The aim of this project is investigate this problem, examining existing solutions to the individual problems (i.e., reordering, mental map preservation etc.), and finally designing a solution for dynamic network visualization using matrices.
Some existing literature to get you started:
- Bach, Benjamin, Emmanuel Pietriga, and Jean-Daniel Fekete. "Visualizing dynamic networks with matrix cubes." Proceedings of the SIGCHI conference on Human Factors in Computing Systems. 2014.
- Behrisch, Michael, et al. "Matrix reordering methods for table and network visualization." Computer Graphics Forum. Vol. 35. No. 3. 2016.
- Beck, Fabian, et al. "The State of the Art in Visualizing Dynamic Graphs." EuroVis (STARs). 2014.
- Rufiange, Sébastien, and Guy Melançon. "Animatrix: A matrix-based visualization of software evolution." 2014 second IEEE working conference on software visualization. IEEE, 2014.
Details
- Supervisor
-
 Alessio Arleo
- Interested?
- Get in contact