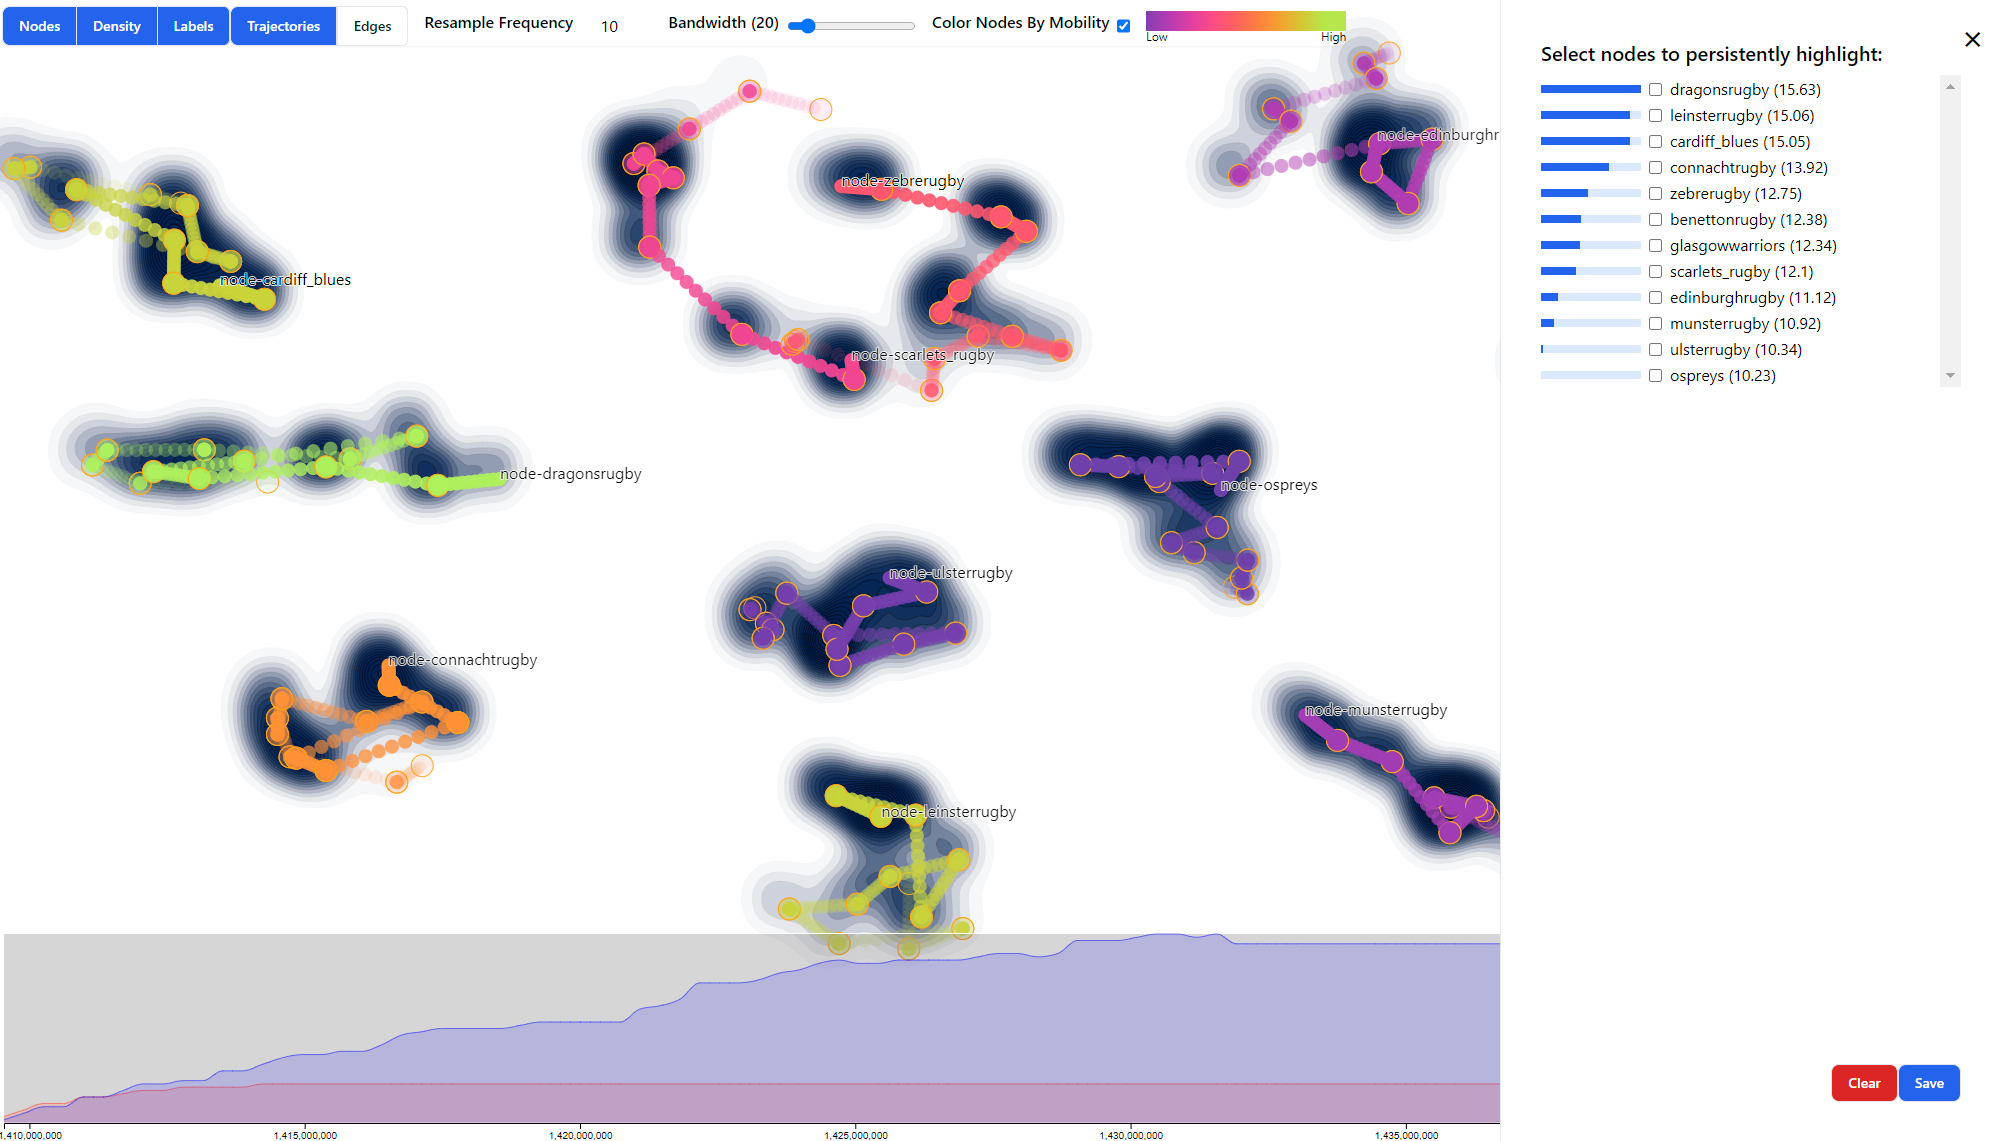
Project: Visualization of Events in the Space-time Cube
Description

Temporal datasets are notoriously hard to visualize. The use of the space-time cube, that is a three-dimensional visualization with the third dimension being time, is a solution that has been initially investigating in the context of cartography and later applied in a number of visualization systems. Space-time cube also appears particularly interesting for its ability to represent trajectories in space and therefore the possibility to represent data that have a continuous time dimension (like the majority of scientific and social phenomena of scientific interest).
The goal of the project is to investigate the current state-of-the-art about the visualization of dynamic networks using the space-time cube and develop a software for the visualization of temporal networks that allows basic interactions with the view and the trajectories themselves.
While oriented to master students, Seminar and Bachelor theses are available, with different degrees of difficulty and effort.
Suggested literature:
- Filipov, V., Ceneda, D., Archambault, D., Arleo, A. (2023). TimeLighting: Guidance-Enhanced Exploration of 2D Projections of Temporal Graphs. Graph Drawing and Network Visualization. GD 2023. Lecture Notes in Computer Science, vol 14465. Springer, Cham.
- Arleo, Alessio, Silvia Miksch, and Daniel Archambault. "Event‐based Dynamic Graph Drawing without the Agonizing Pain." Computer Graphics Forum. 2022.
- Bach, Benjamin, et al. "A review of temporal data visualizations based on space-time cube operations." Eurographics conference on visualization. 2014.
Details
- Supervisor
-
 Alessio Arleo
- Interested?
- Get in contact