Project: Visual Analytics for Symbolic Pattern Search in Time Series
Description

Time series data, collected across various domains, holds valuable insights that can drive decision-making. Identifying specific patterns within this data is valuable but challenging. For example, a shop owner might want to know if their sales have ever dropped for seven consecutive days. In finance, detecting 'pump and dump' schemes, characterised by a rapid rise and subsequent fall in stock prices, is vital. In the energy sector, identifying simultaneous high-load periods across multiple regions can prevent blackouts and optimise resource distribution.
There are currently three approaches for finding these patterns in time series. Query by sketch and query by example both rely on visual inputs. It can therefore be dfficult to fully understand what is being searched for as it is hard to express these queries with natural language. Users can also search for patterns programmatically. However, even basic pattern queries can be complex to construct in common programming languages.
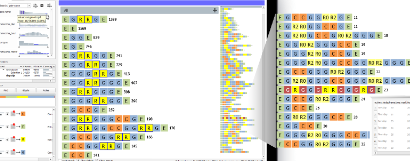
A particular area of interest for time series in recent years has been symbolic representations. Symbolic representations simplify the data into meaningful symbols for each specific time interval. This allows us to express the queries in interpretable regex queries. However, no domain- agnostic visual interface currently exists to make this method accessible to users.
Therefore, the goal of the project is to use symbolic representations of time series in a visual interface to empower users to perform pattern searching and explore time series data in an effective and intuitive manner across all domains.
Details
- Student
-
IDIona Donaldson
- Supervisor
-
 Fernando Paulovich
- Secondary supervisor
-
 Bram Cappers