Project: Multi-level Dimensionality Reduction using Graph Aggregation and Summarization to Explore Large Datasets
Description
The interplay between graph drawing (GD) and dimensionality reduction (DR) has recently been considered through a framework that splits the DR process into two phases: relationship modeling and mapping. In the former, the relationships aimed to be represented on the final layout are modeled using a graph, while in the latter, such a graph is embedded in the plan. With this, elements of graph theory can now be utilized to enhance DR techniques and provide new directions for research.
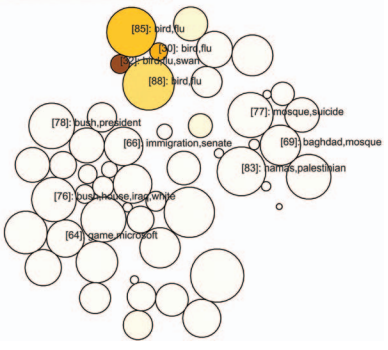
One idea is to utilize the concept of graph summarization or aggregation to facilitate the multi-level exploration of DR layouts. In this process, the graph modeling the DR relationships can be initially aggregated (by joining nodes and/or edges), representing an overview of the data. Details can then be displayed on demand through user interaction. This concept can be beneficial in scenarios where large datasets (with millions of instances) are considered, such as in protein folding processes or document (textual) collection analysis.
The interplay between graph drawing (GD) and dimensionality reduction (DR) has recently been considered through a framework that splits the DR process into two phases: relationship modeling and mapping. In the former, the relationships aimed to be represented on the final layout are modeled using a graph, while in the latter, such a graph is embedded in the plan. With this, elements of graph theory can now be utilized to enhance DR techniques and provide new directions for research.
One idea is to utilize the concept of graph summarization or aggregation to facilitate the multi-level exploration of DR layouts. In this process, the graph modeling the DR relationships can be initially aggregated (by joining nodes and/or edges), representing an overview of the data. Details can then be displayed on demand through user interaction. This concept can be beneficial in scenarios where large datasets (with millions of instances) are considered, such as in protein folding processes or document (textual) collection analysis.
References:
- Paulovich, F.V., Arleo, A. and van den Elzen, S. (2025), When Dimensionality Reduction Meets Graph (Drawing) Theory: Introducing a Common Framework, Challenges and Opportunities. Computer Graphics Forum e70105.
- Yike Liu, Tara Safavi, Abhilash Dighe, and Danai Koutra. 2018. Graph Summarization Methods and Applications: A Survey. ACM Comput. Surv. 51, 3, Article 62 (May 2019), 34 pages.
- F. V. Paulovich and R. Minghim, "HiPP: A Novel Hierarchical Point Placement Strategy and its Application to the Exploration of Document Collections," in IEEE Transactions on Visualization and Computer Graphics, vol. 14, no. 6, pp. 1229-1236, Nov.-Dec. 2008, doi: 10.1109/TVCG.2008.138
Details
- Supervisor
-
 Fernando Paulovich