Project: On the Continous Visualization of Graphs Structures
Description
Graphs are mathematical structures consisting of vertices (or nodes) and edges (connections between nodes) used to represent relational information present in datasets. For analysis, it is common to visually represent graphs using geometric primitives, ensuring that the geometry of the drawing accurately reflects the topology of the original data structure. By definition, graphs are discrete structures. Consequently, the visual representations are also discrete so that the space between nodes or edges does not represent any data information. In other words, the most common visual representations, such as node-link diagrams and adjacency matrices, do not represent transitions between nodes as a continuum, meaning that what lies between nodes or edges does not represent data.
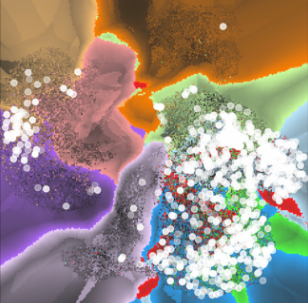
In this project, we will explore the concept of inverse projection from Dimensionality Reduction, aiming to create visualizations for graphs that enable the representation of information between nodes. Inverse projections are techniques that can reconstruct multi-dimensional data instances from bi-dimensional points (or pixels) and have been used in various applications, for instance, in the representation of classification boundary maps. Our idea is to apply a similar concept, focusing on reconstructing nodes and edges from bi-dimensional points, which could enable smooth and continuous transitions between nodes and edges.
References:
- Deep Learning Inverse Multidimensional Projections M. Espadoto, F. C. M. Rodrigues, N. S. T. Hirata, R. Hirata Jr, A. Telea. Proc. EuroVA, 2019
- M. Espadoto et al., "UnProjection: Leveraging Inverse-Projections for Visual Analytics of High-Dimensional Data," in IEEE Transactions on Visualization and Computer Graphics, vol. 29, no. 2, pp. 1559-1572, 1 Feb. 2023, doi: 10.1109/TVCG.2021.3125576.
Details
- Supervisor
-
 Fernando Paulovich
- Secondary supervisor
-
 Stef van den Elzen
- Interested?
- Get in contact