back to list
Project: Measuring perceptual distortion on dimensionality reduction plots
Description
Dimensionality
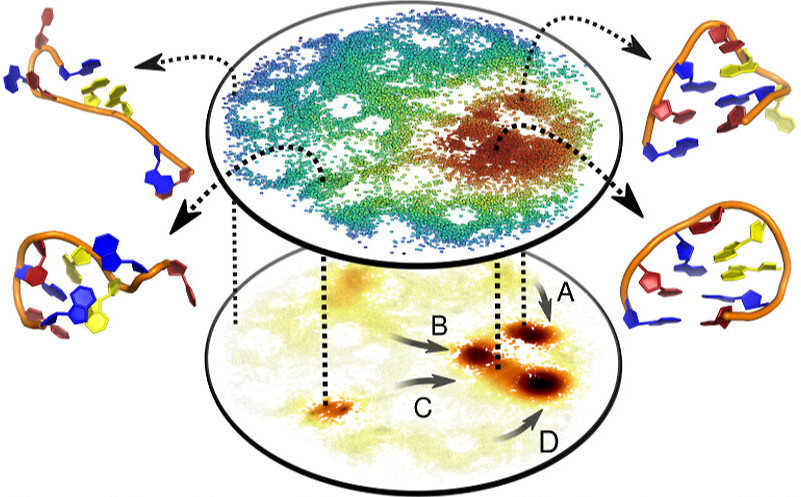
Reduction (DR) is a technique used to project high-dimensional points
to lower-dimensional spaces. A common application is to project the
dataset to a 2D plane, so it can be visualized as a scatterplot.
However,
we know that this process is not perfect, and it tends to create some
distortions of the data, that we need to take into account when we
analyze the projections [1]. But these distortions can be complex and
hard to understand, since we cannot visualize the original data. To
complicate matters, there are many DR methods, each with its set of
hyperparameters to adjust, that will produce very different projections.
Which one to choose? How much can we trust it? What parts of the
projection are good or bad?
Over
the years, the DR community has come up with many quality metrics that
automatically compute "how good" the projection is. Again, we have the
problem of a multitude of metrics (with their own hyperparameters) that
measure different things. But they all have a common issue: they only
measure how close structurally the projected points are to the original
ones, disregarding the visual aspect of it [2].
In
this project we want to develop new DR quality metrics that are focused
on the visual perception of the projection. How much can the user trust
the clusters, holes and other structures of points that can be seen in a
2D scatterplot? Is it really in the data, or an artifact created by DR?
[1] https://doi.org/10.1111/j.1467-8659.2010.01835.x
[2] https://doi.org/10.1111/cgf.70101
Details
- Supervisor
-
 Jaume Ros
- Secondary supervisor
-
 Fernando Paulovich