Project: Responsive visualizations across many devices
Description
Data visualizations, whether in the news, in visual analytics systems, or for business applications, are frequently used across a variety of devices. This might include desktop computers with large screens, laptops, tablets, smartphones, and even smartwatches. Responsive visualization is the practice of designing and developing visualizations to automatically adapt to all these devices, accounting for their differences in display size (as well as resolution and aspect ratio), interaction modalities (e.g., touch screen vs. mouse/keyboard), and usage environments (e.g., inside/outside, seated/on-the-go).
In an ideal world, all visualizations would seamlessly adapt across all devices. However, in practice, this is difficult for a number of reasons: responsive visualization is poorly supported by commonly used software and tools, constraints on time and budget often mean responsiveness is deprioritized, and a lack of best practices makes it challenging to integrate responsive design into visualization development processes. As a consequence, visualizations are often made "responsive" by creating a mobile and a desktop version, with other types of devices neglected.
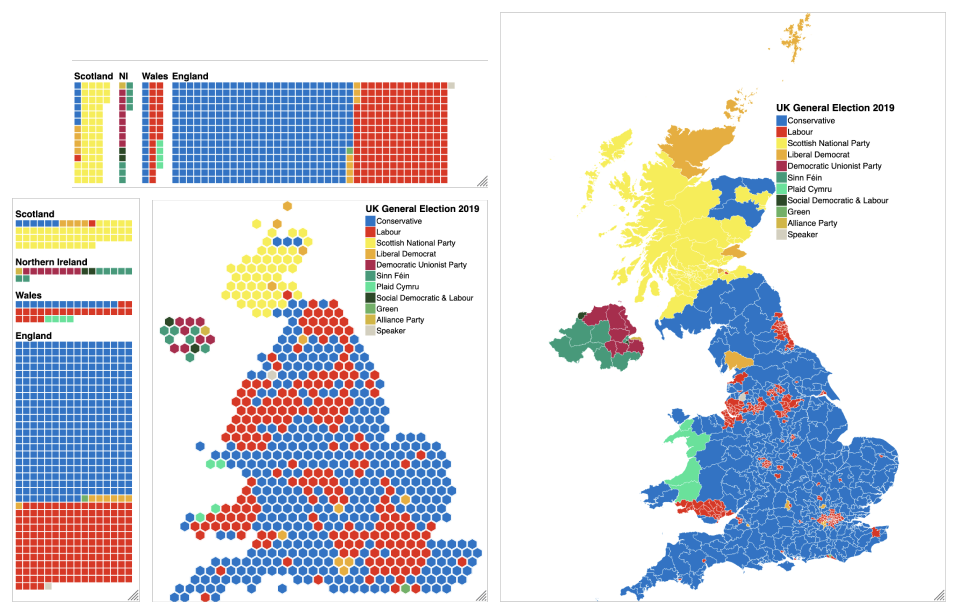
In this project, you will develop a proof-of-concept of such an "ideal world" responsive visualization. Depending on your interests, we will select one or more suitable datasets and visualization types. I am particularly interested in geographic data and map-based visualizations, but open to other use cases as well. Over the course of the project, you will then investigate existing best practices and techniques for responsive visualization and your chosen type of visualization. Then you will use this information to design and develop a highly flexible responsive visualization that adapts to as many different devices as possible, as seamlessly as possible. Finally, you will evaluate your creation and the process of getting there: major challenges you experienced, successes, novel insights, shortcomings of the final product, etc.
You will need some experience with web development (HTML/CSS/JavaScript, experience with a framework like Svelte/React is helpful, as is prior experience with visualization libraries like D3), but more importantly a willingness to learn the skills you are missing (which I can support you with).
This project can accommodate multiple students if sufficiently different datasets and visualization types are chosen. I am also interested in discussing your alternative ideas for MSc projects in the area of responsive visualization.
Details
- Supervisor
-
 Sarah Schöttler
- Interested?
- Get in contact