Project: Dependency Graph for System-Level Simulations
Description
Deriving and visualizing the impact of parameter change to down-stream variables
We have models to run simulations of different systems and their sub-components, which allows to optimize configurations for the scanner to achieve a given objective.
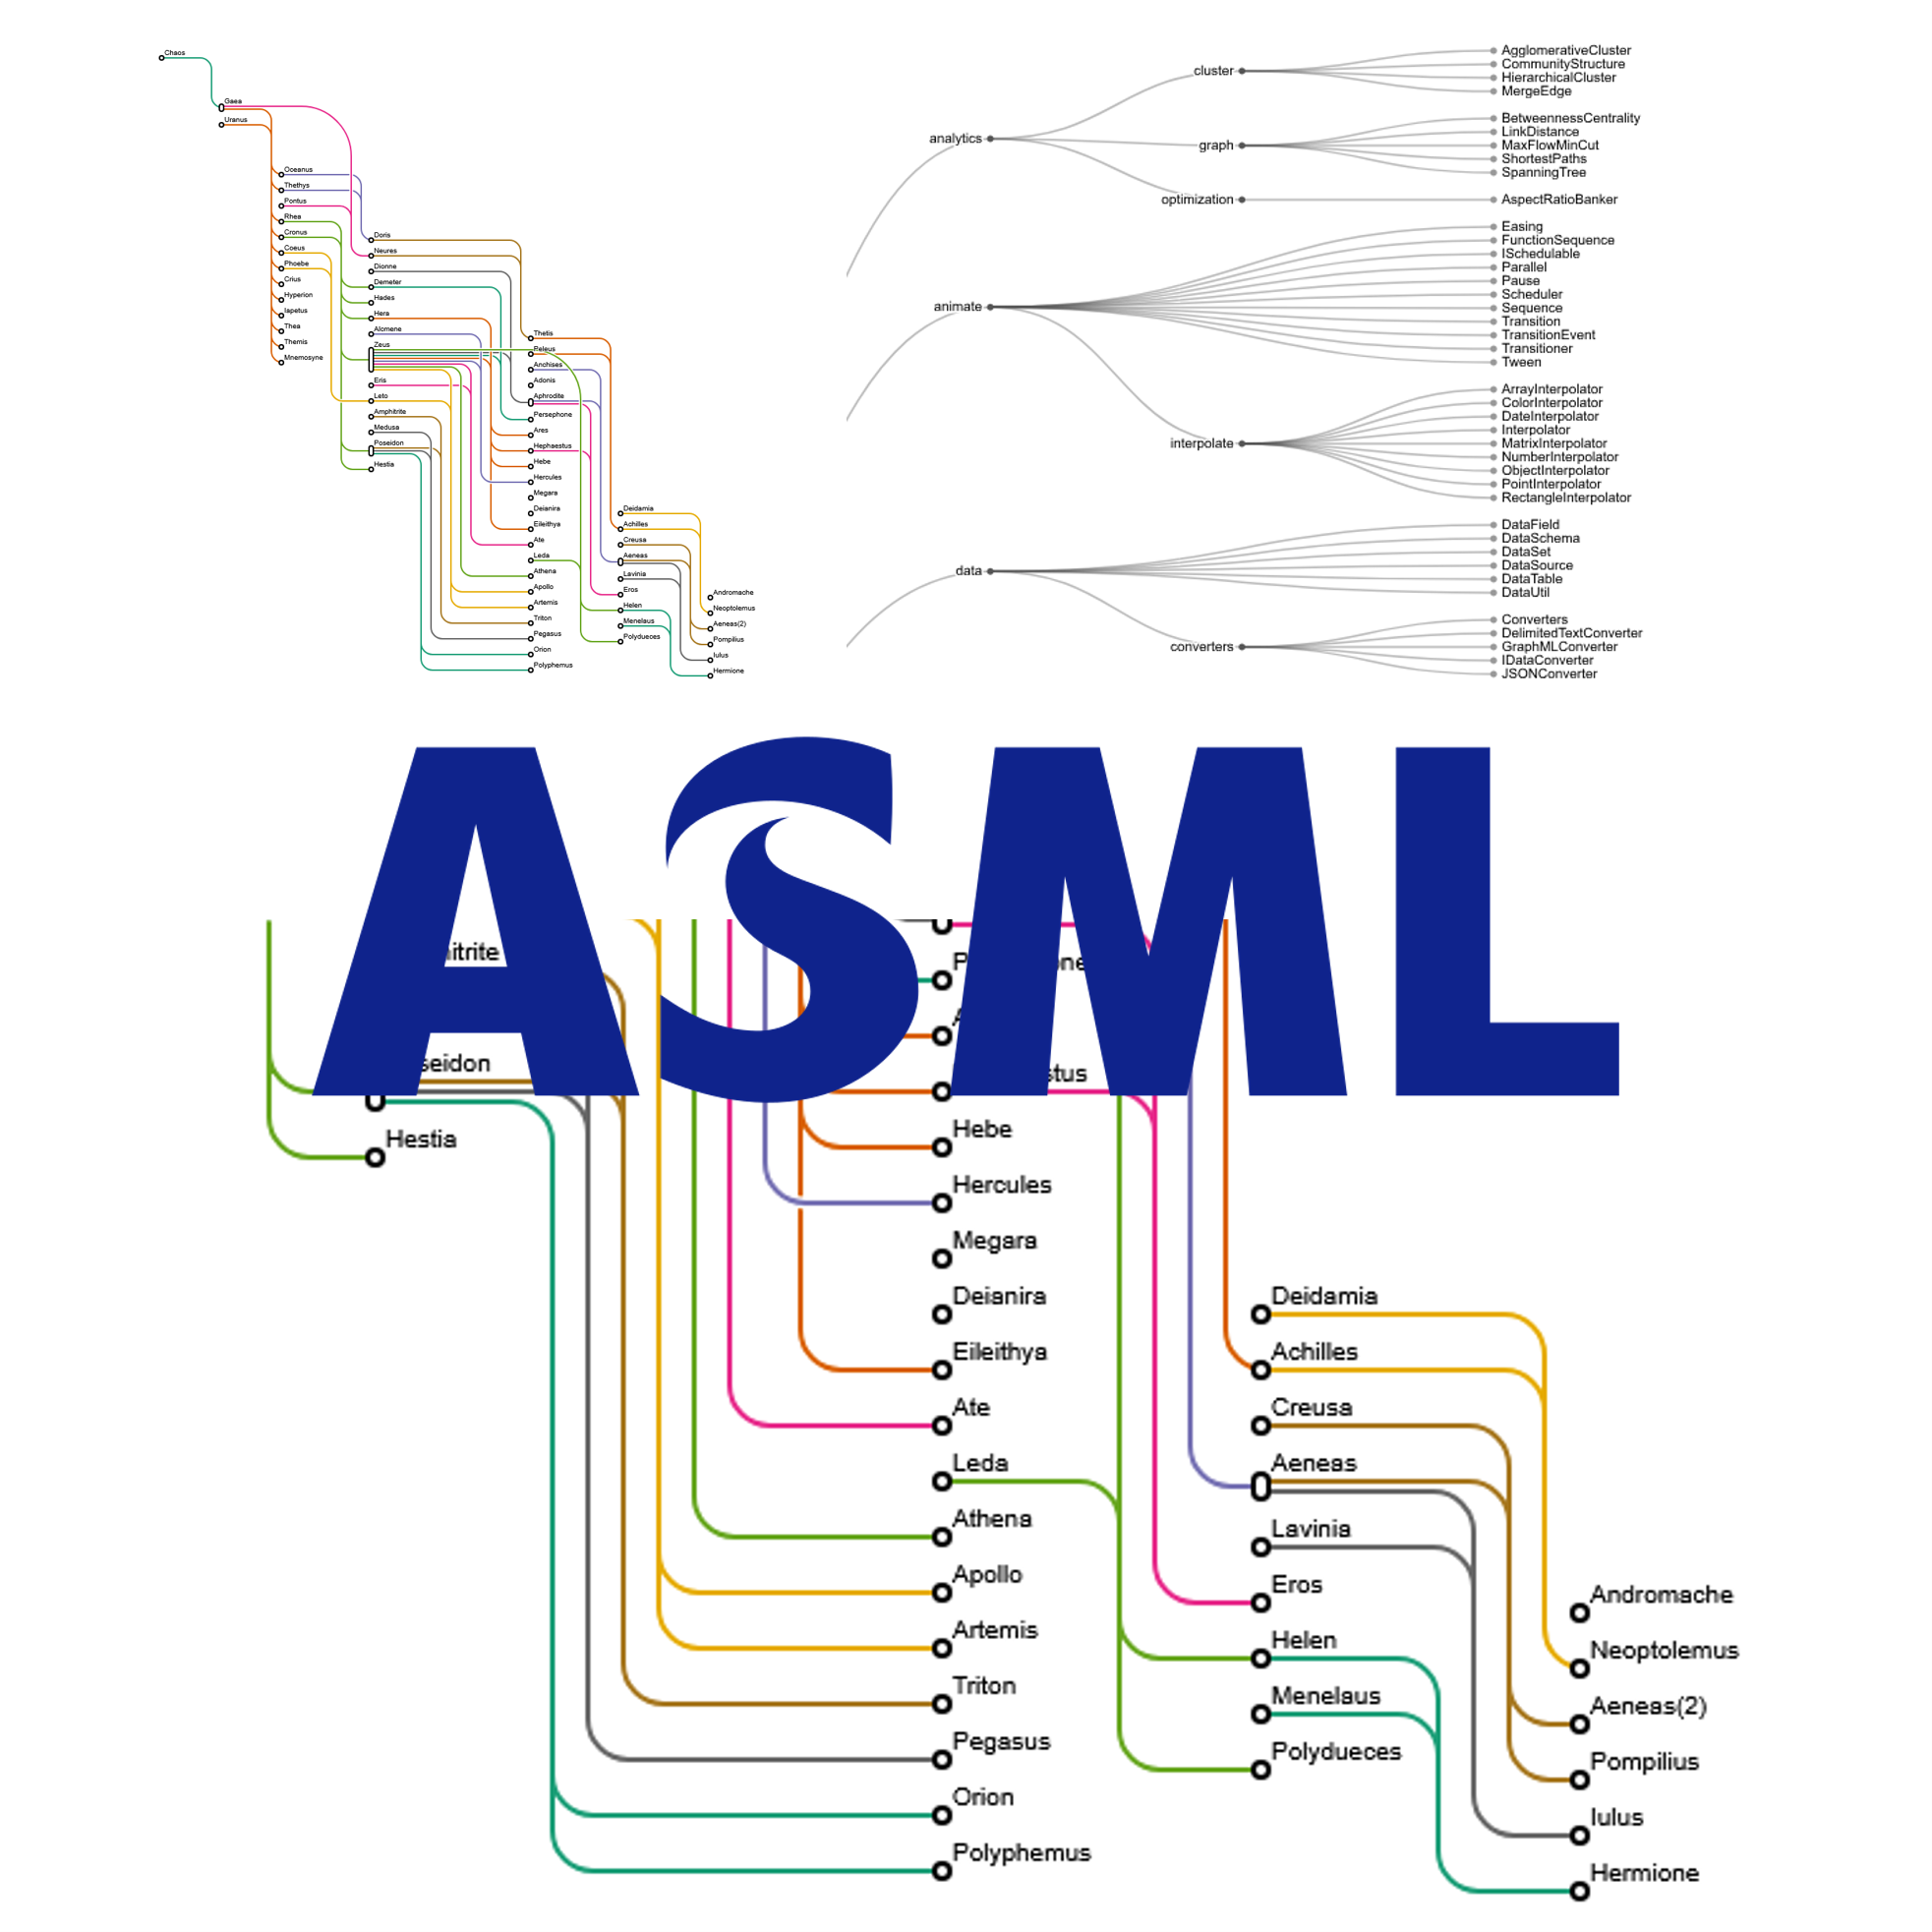
Our simulations have hundreds of variables, which can be free parameters or outcomes. Such variables belong to dozens of modules. The variables are organized in a Directed Acyclic Graph (DAG).
To understand the relationships in a scanner, the DAG needs to be visualized. Currently, a simple DAG visualization is used, but it is overwhelming for the user. In this project, the student will work on creating an interactive visualization which allows to understand the relationships between the modules, providing first an overview and providing details on demand. A variety of techniques can be used and adapted for this task.
- (Advanced) Visualization knowledge
- (Basic) SW Engineering skills
- Javascript visualization libraries (e.g., D3.js)
- React
Expected Deliverables
- A set of visualizations in React.js to analyze display the DAG representing the Virtual Scanner
The project will be supervised by Nicola Pezzotti at ASML Research and Stef van den Elzen and/or Anna Vilanova at TUe. The student is expected to be at ASML in Building 7 for 3 days a week
Details
- Student
-
DMDesiree Monteiro
- Supervisor
-
 Anna Vilanova
- Secondary supervisor
-
 Nicola Pezzotti
- External location
- ASML