Project: Explainability Comics
Description
Artificial Intelligence (AI) gained increasing attention in a wide range of fields, such as the detection of cancer in X-rays, fraud detection in money transaction networks, or the generation of novel drug molecules. However, most of the best-performing AI techniques are a black box, and users are unable to understand their reasoning. This makes the application of AI especially in critical domains (e.g., health care) hard or can prevent it completely.
The field of Explainable AI (XAI) emerged with the purpose of either opening the black box and understanding the AI's internal reasoning or explaining AI outputs post hoc. However, most XAI methods are targeted at data scientists and are hard to interpret for less technical users [1, 2].
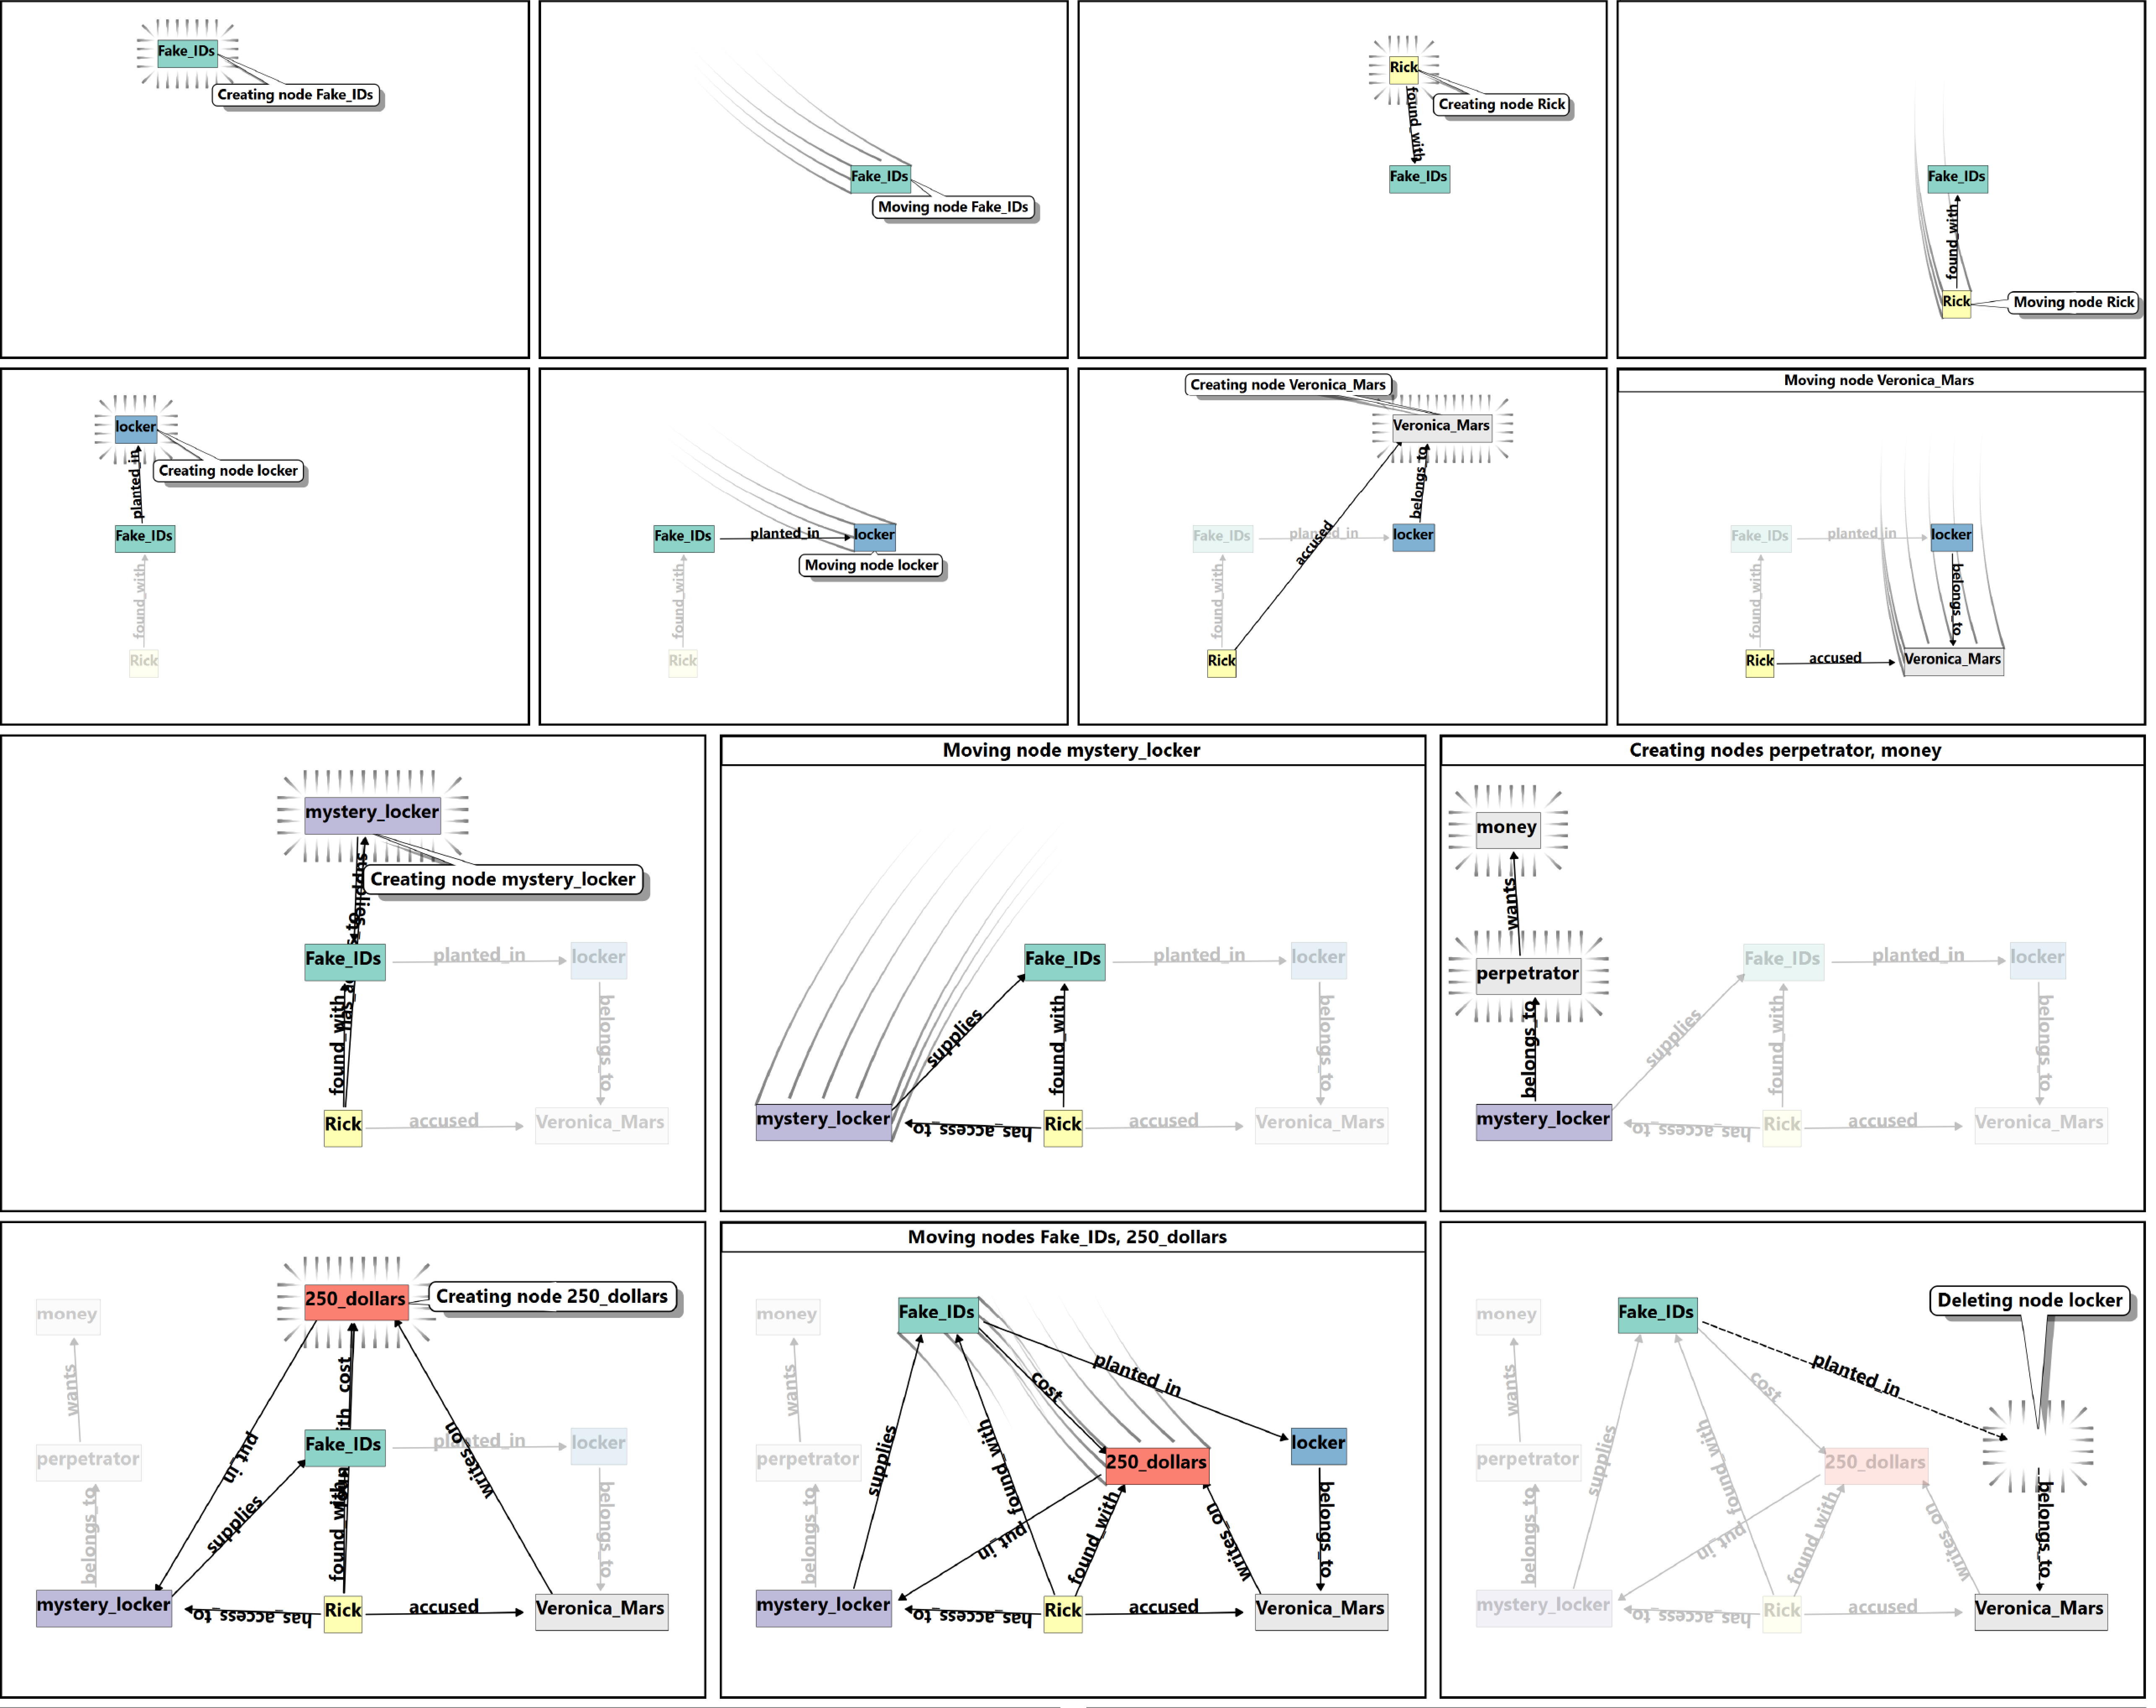
On the other hand, the field of Data Comics has emerged to facilitate the communication and education of complex topics to a broader audience, such as temporal networks [3] (see image) or the application of software and data in healthcare scenarios [4].
In this project, we aim at combining the advantages of both fields: 1) XAI to increase understanding of the AI's outputs and 2) Data Comics to target a non-technical audience. This project will involve (but is not limited to):
1) The implementation of a prototype (including the visualization of an XAI method)
2) The design of comics for XAI (either automatic or manually based on design guidelines)
3) A user study to compare the comics to the state-of-the-art
Requirements:
1) Visualization background
2) Knowledge of at least one framework suitable for visualization (e.g., D3, Qt)
3) Knowledge of XAI methods (e.g., SHAP, LIME, Grad-CAM, SubgraphX)
Sources:
[1] Moreira Cunha, Bianca, and Simone Diniz Junqueira Barbosa. "Evaluating the effectiveness of visual representations of shap values toward explainable artificial intelligence." Proceedings of the XXIII Brazilian Symposium on Human Factors in Computing Systems. 2024.
[2] Ji, Yingchao. "Explainable AI methods for credit card fraud detection: Evaluation of LIME and SHAP through a User Study." (2021).
[3] Bach, Benjamin, et al. "Telling stories about dynamic networks with graph comics." Proceedings of the 2016 CHI conference on human factors in computing systems. 2016.
[4] Schreiber, Andreas, and Regina Struminski. "Visualizing provenance using comics." 9th USENIX Workshop on the Theory and Practice of Provenance (TaPP 2017). 2017.
Details
- Supervisor
-
 Kay Roggenbuck
- Secondary supervisor
-
 Stef van den Elzen
- Interested?
- Get in contact