Project: Applying Comic Theory to Data Comics
Description
In 2015, Zhao et al. introduced Data Comics [1] as 'Sequential art for data-driven storytelling'. Since then, researchers have applied it to different domains such as education [2], data provenance [3], or dynamic network visualization [4]. Each method usually establishes new methods to generate, condense, or annotate the data comics.
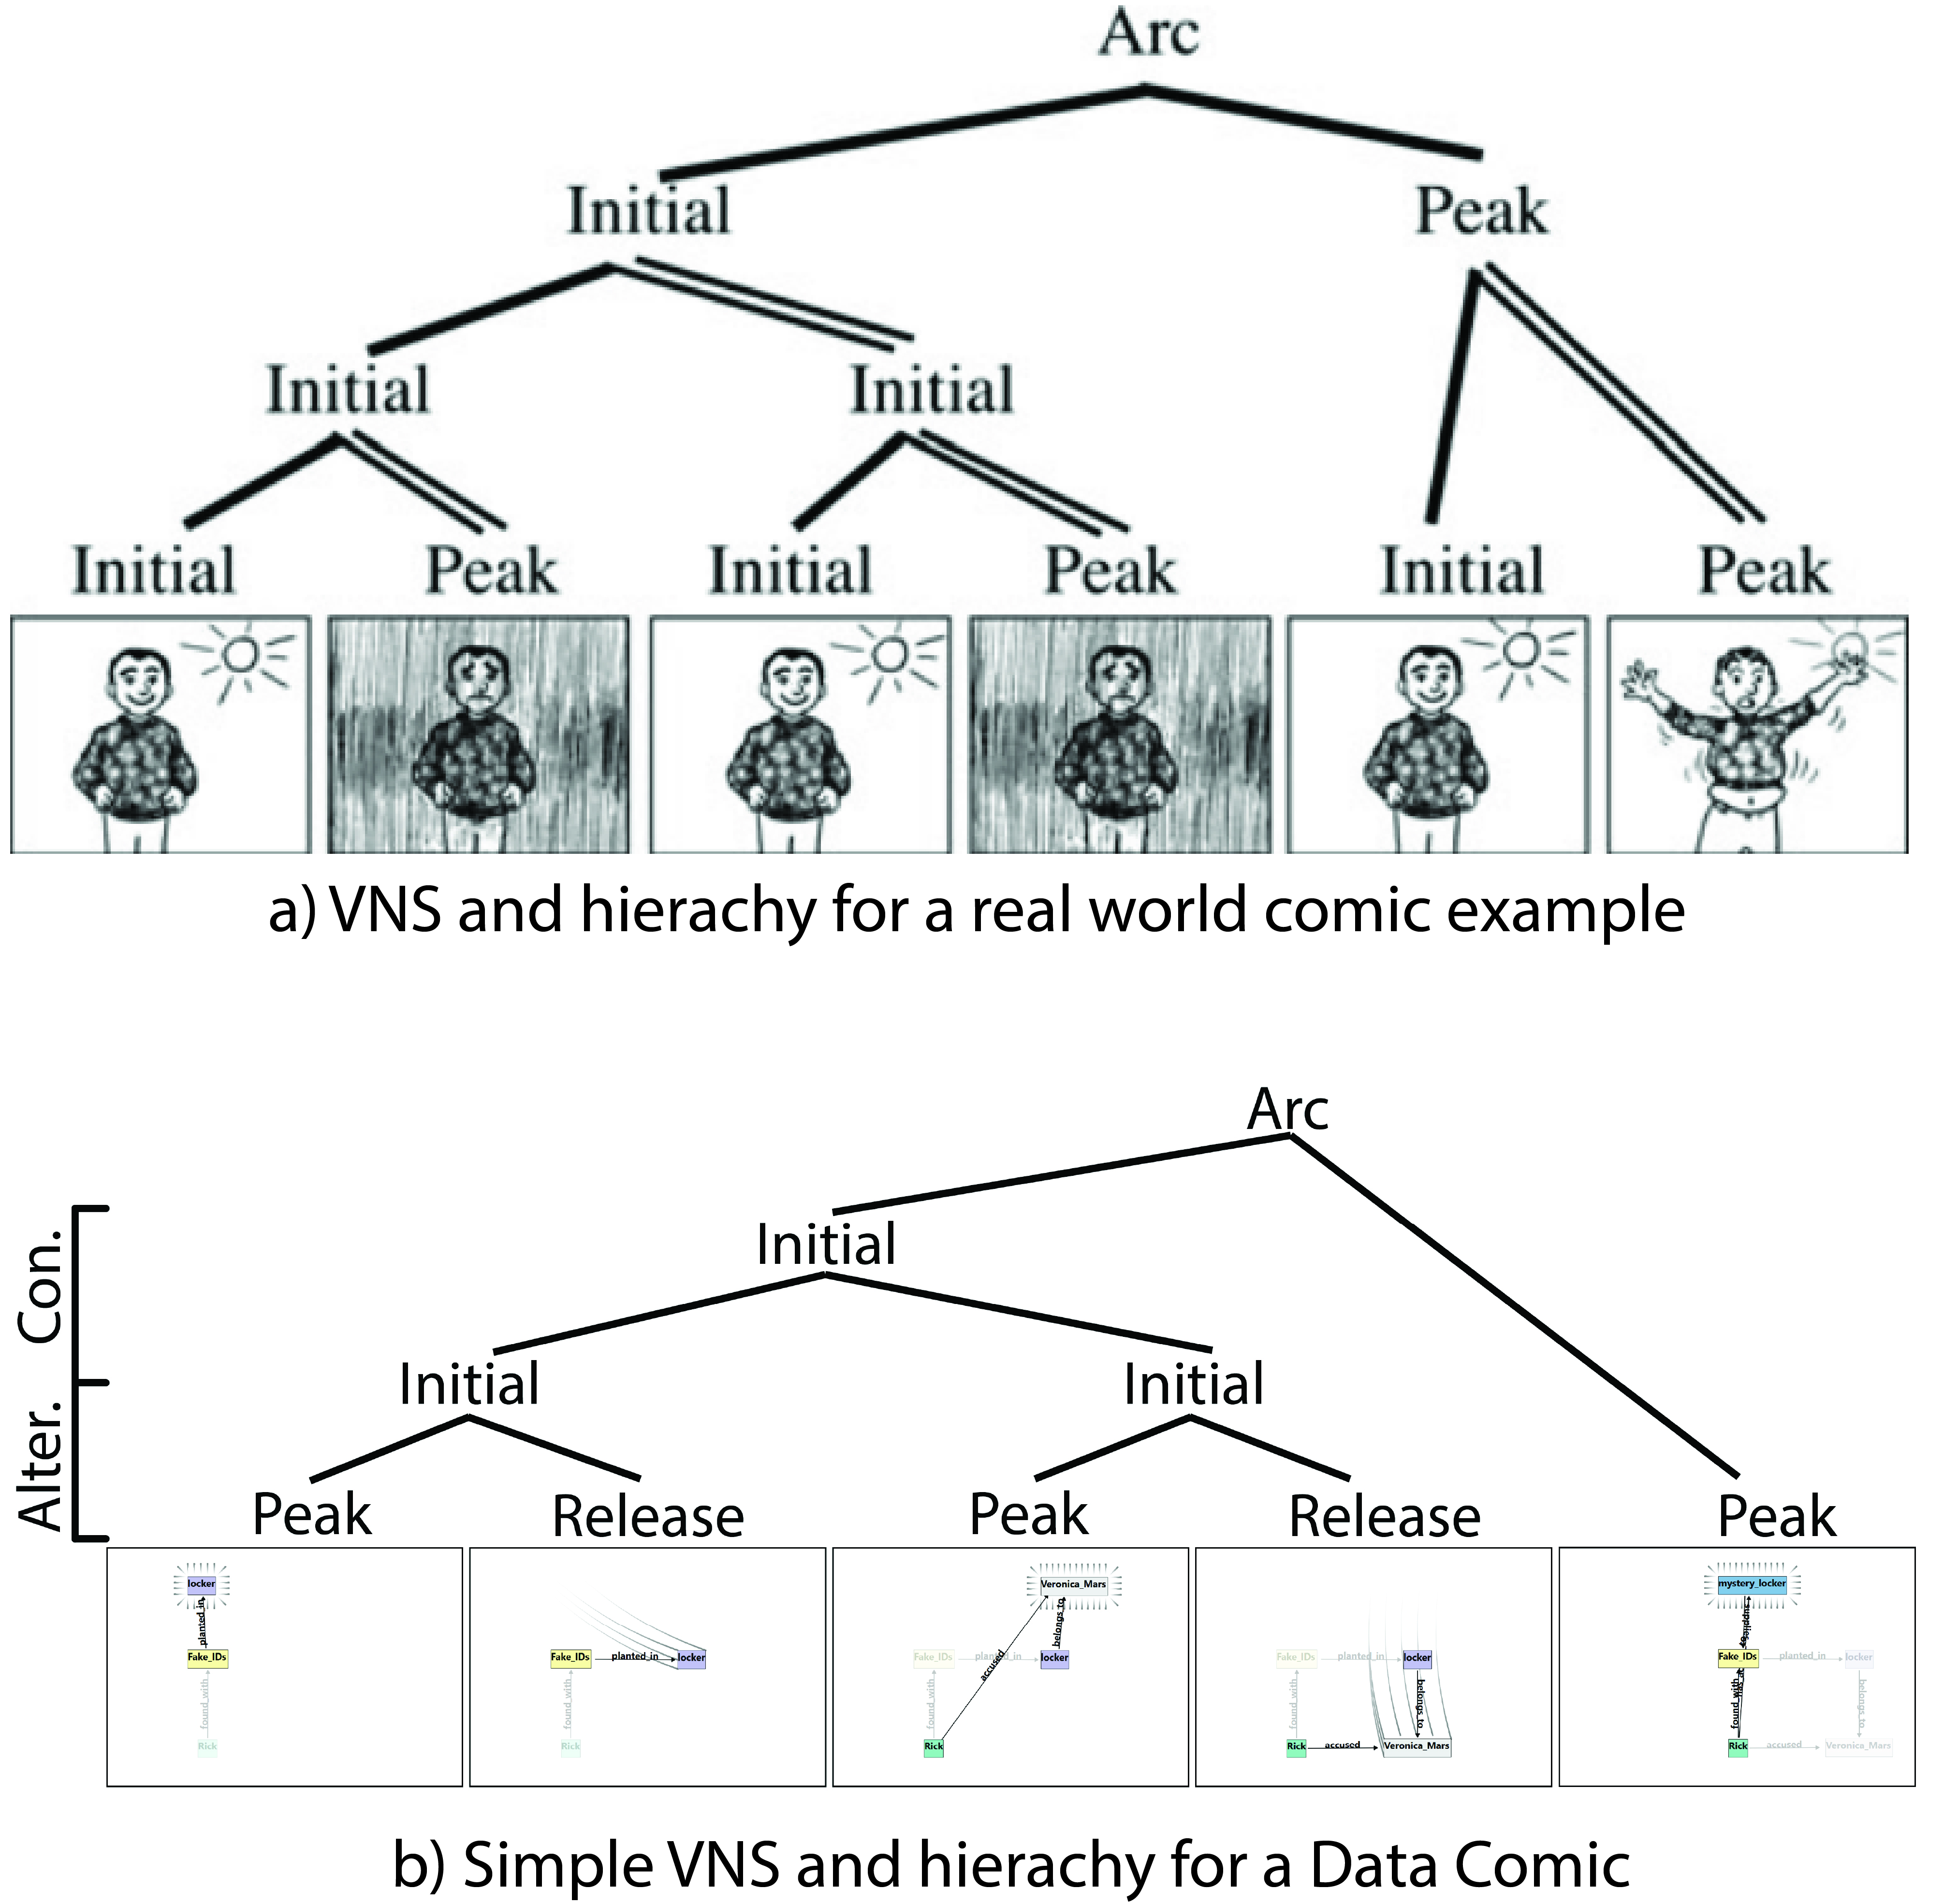
On the other hand, in comic theory, the structure of visual narratives is studied well, for example, in the form of the Visual Narrative Structure (VNS) [5]. Within the VNS, classes with different importance scores are assigned to panels, and a hierarchy can be built to capture the structure of a whole Arc on different levels. These concepts, i.e., importance scores and hierarchies, are familiar concepts and enable the application of well-established algorithms (for example, in the area of information diffusion). Furthermore, based on comic theory, this could be used to identify states of confusion in process provenance or enable novel refinement methods for data comics. Nevertheless, no work has applied VNS to Data Comics before.
In this exploratory project, we aim to discover opportunities to apply VNS to Data Comics to support Data Comic generation, condensation, and annotation. Possible directions within the project are:
1. Identify methods to automatically assign VNS structures to Data Comics: Current work using VNS is purely manual. The automated assignment might involve combining temporal and importance information of panels within the data comic.
2. Assuming the VNS and hierarchy are already built, which refinements could this enable? For example, semantic zooming for different levels of detail, merging or deleting panels, etc.
Requirements:
1) Visualization background
2) Knowledge of at least one framework suitable for visualization (e.g., D3, Qt)
Sources:
[1] Zhao, Zhenpeng, Rachael Marr, and Niklas Elmqvist. "Data comics: Sequential art for data-driven storytelling." tech. report (2015).
[2] Boucher, Magdalena, et al. "Educational data comics: What can comics do for education in visualization?." 2023 IEEE VIS workshop on visualization education, literacy, and activities (eduVis). IEEE, 2023.
[3] Schreiber, Andreas, and Regina Struminski. "Visualizing provenance using comics." 9th USENIX Workshop on the Theory and Practice of Provenance (TaPP 2017). 2017.
[4] Bach, Benjamin, et al. "Telling stories about dynamic networks with graph comics." Proceedings of the 2016 CHI conference on human factors in computing systems. 2016.
[5] Cohn, Neil. "Visual narrative structure." Cognitive science 37.3 (2013): 413-452.
Details
- Student
-
RMRose van Mierlo
- Supervisor
-
 Kay Roggenbuck
- Secondary supervisor
-
 Stef van den Elzen