back to list
Project: Visualizing Protein Energy Landscapes Beyond Projections
Description
Introduction
Protein folding
Proteins are at the base of most biological processes, and their study has been central in the bio-sciences for decades. At its core, a protein is a large molecule in the form of a long chain; however, forces at the atomic level between the atoms (and the environment) make it bend in certain ways which result in complex 3D shapes. The specific 3D structures are what give proteins the ability to perform all kinds of biological functions. For any protein, we mostly know its linear (primary) structure, which is encoded in our genes, but determining which 3D shape will it take once folded is not easy at all. In fact, this problem, known as the protein folding problem, has been central in biology research for decades. Lab experiments are usually expensive (in terms of money) and slow, while computer simulations are expensive (computationally) and not accurate enough. In recent years, there have been major breakthroughs in the field, such as AlphaFold [1].Protein energy landscapes
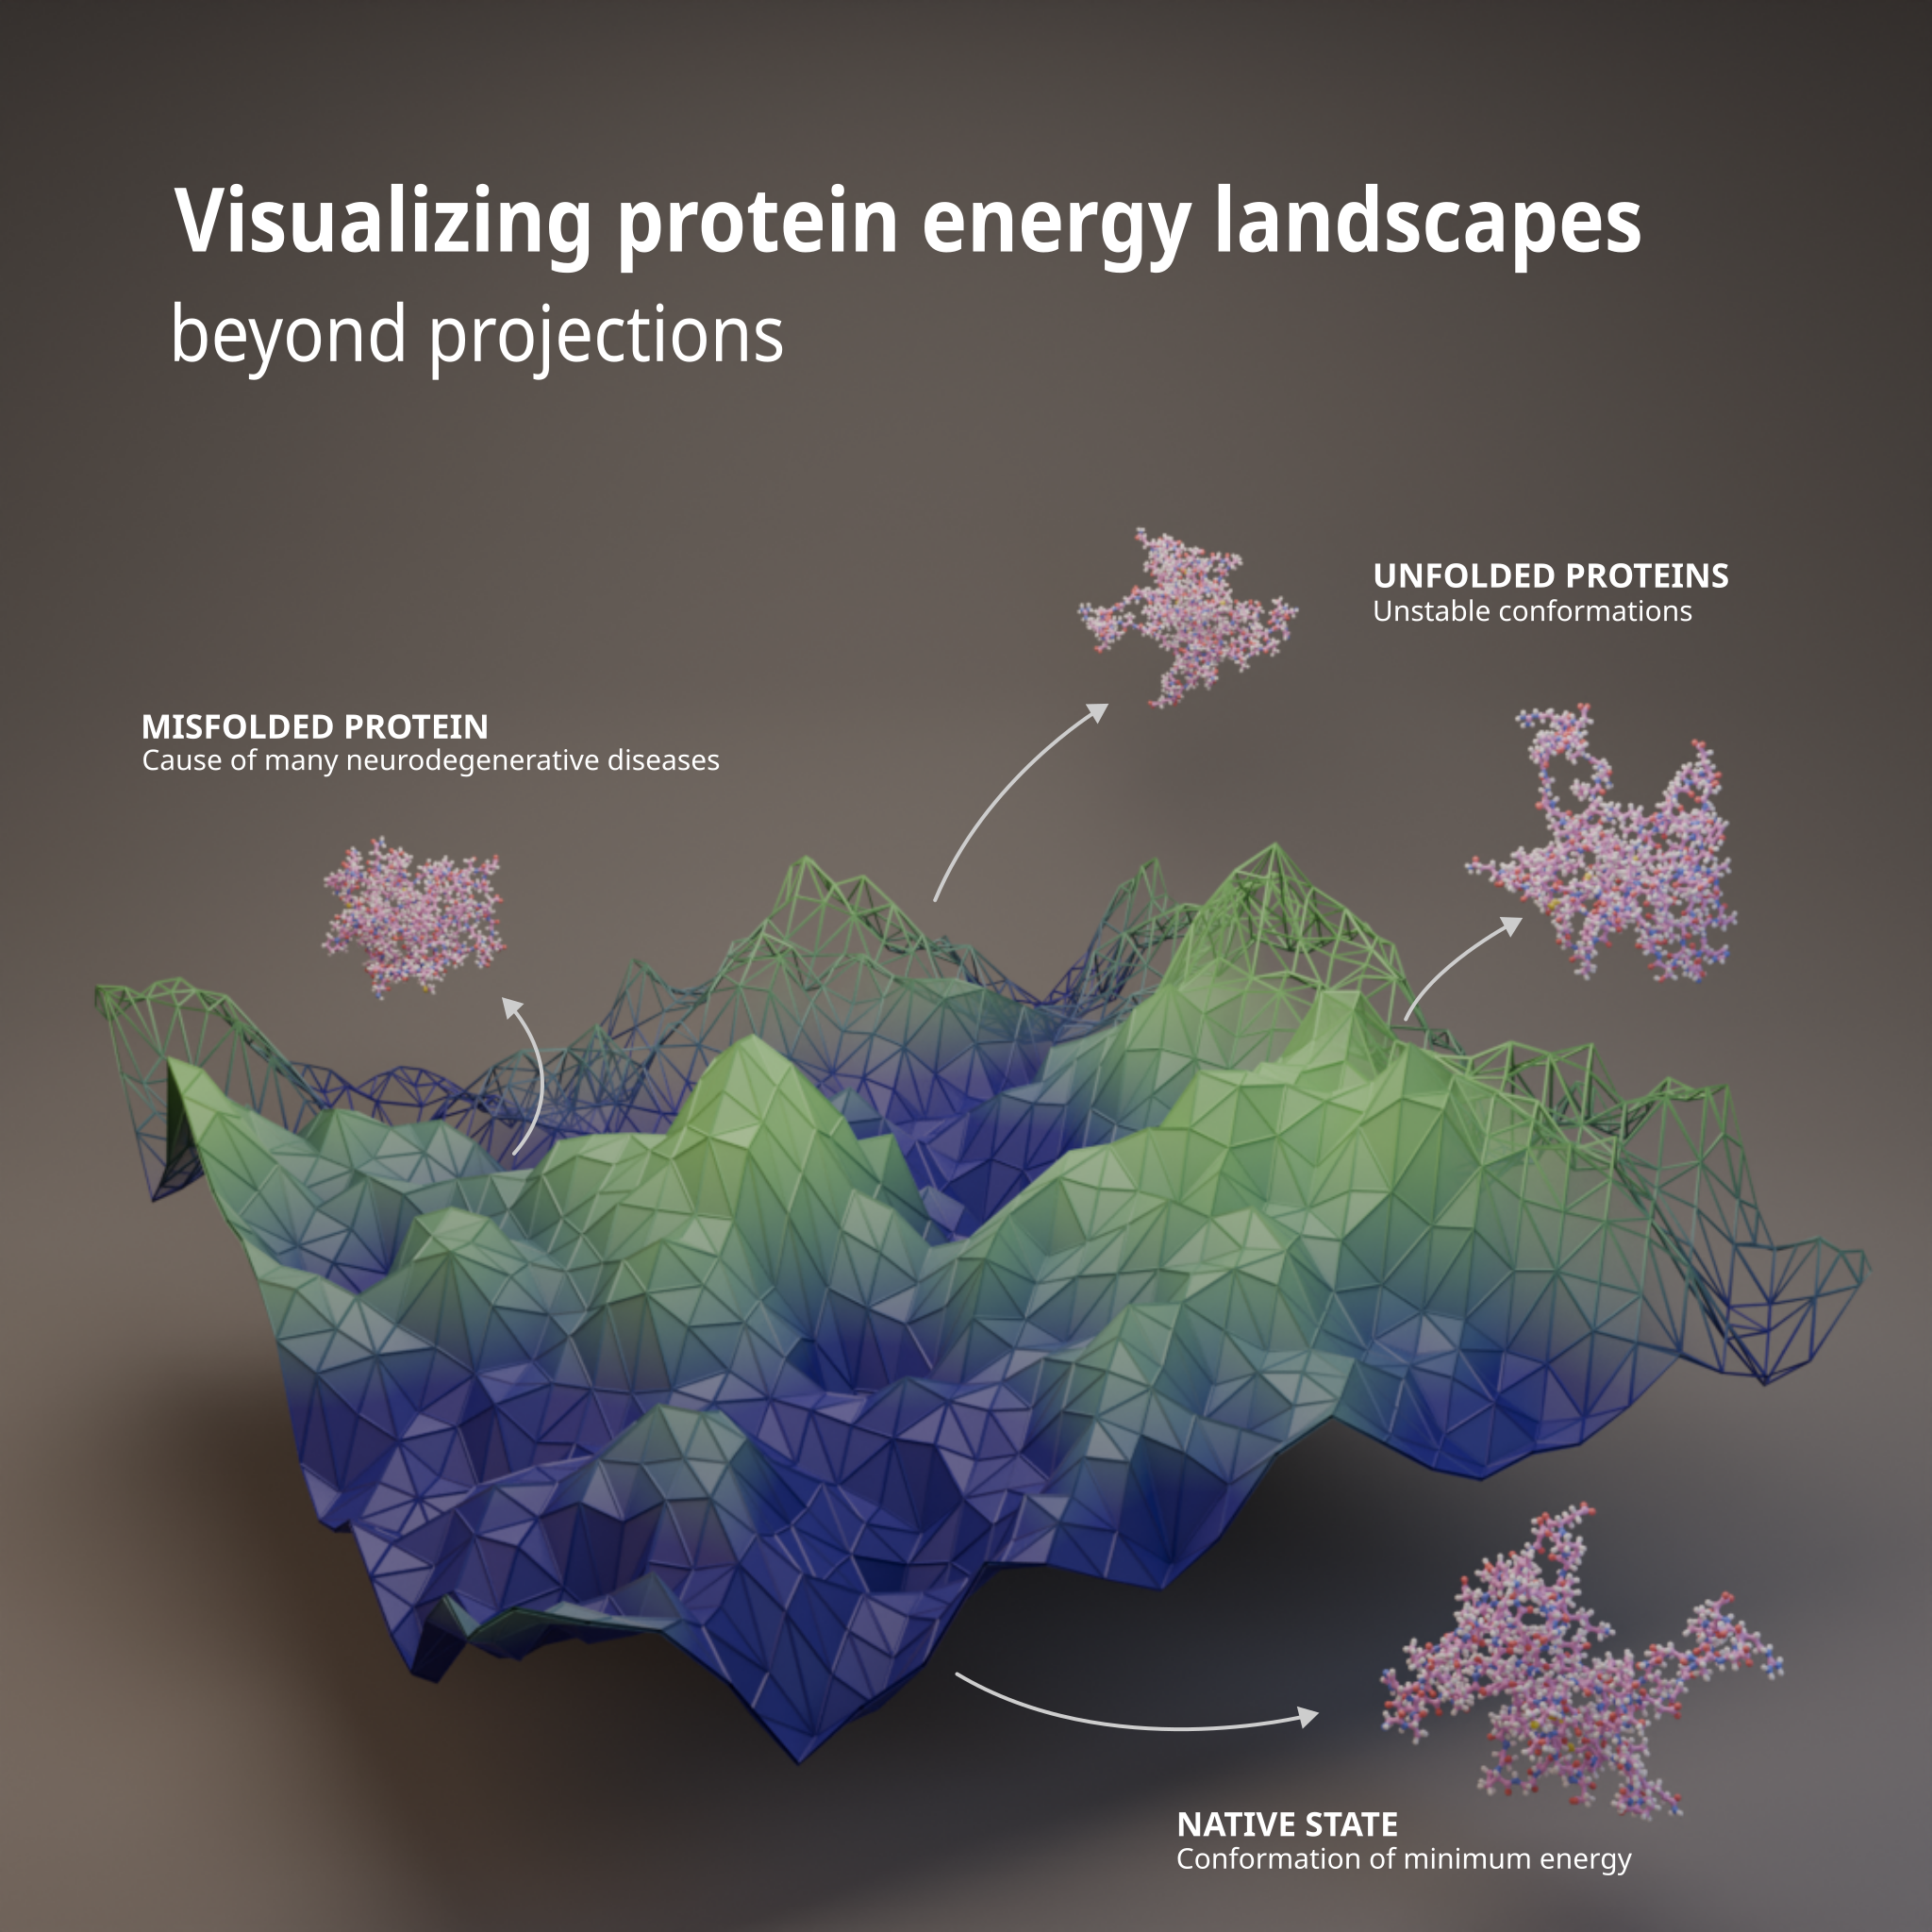
A common way to think about protein folding is through the energy landscape metaphor, which sees the folding protein as a ball rolling down a hill to find the most thermodinamically stable state (lowest free energy), similar to how we think of gradient descent. Rather than "rolling", a protein will change its 3D shape continuously to move towards more energetically favorable states. In this context, we can relate many relevant concepts in biology to the topology of the landscape:- The native state corresponds to the global minimum, and is where proteins are likely to fold towards.
- Metastable states are other large basins of local minima.
- Energy barriers are the ridges that proteins need to overcome to move to another basin.
- Folding pathways are alternative routes that the folding protein can take to reach the global minimum.
- A smooth landscape with a funnel shape will make it easy for the folding protein to reach the global minimum, while a rough one might cause it to get suck in local minima.
Visualization of energy landscapes
While the theory of protein energy landscapes is widely accepted and used to explain protein folding processes, the truth is that we do not really know how they look. In the project image, you see what a 2D landscape might look like, but in reality such a landscape is impossible to visualize like this, since the space of all possible shapes for a protein is very high-dimensional.Since the late 90's, researchers in biophysics have tried to design simple visualizations to represent the main features of energy landscapes, which mainly come in two forms:- Dimensionality reduction techniques to visualize the landscape as a 2D surface (e.g. [2]).
- Disconnectivity graphs to visualize the topology of the high-dimensional surface as a tree (e.g. [3]).
The project
The expected outcome is a visual analytics prototype that demonstrates improved ways of exploring protein folding energy landscapes beyond traditional methods. We will explore the possibility of modeling the energy landscape of proteins as a graph, and its possibilities with the use of advanced visualization techniques for networks. These may include:- Hierarchical representations
- Visualizing differences between two energy landscapes
- Edge bundling and detecting main folding pathways
- Explicitly representing energy barriers
- Complementing the network visualization with relevant 3D molecular structures
- Symbolic representations for 3D shapes, which enable techniques for filtering and pattern discovery.
- Alternative distance functions between 3D structures and how it impacts the features captured by the model.
- Improving existing techniques based on dimensionality reduction or disconnectivity graphs, applying advanced visualization theory and possibly integrating them together in a more complex tool.
References
- J. Jumper et al., Highly accurate protein structure prediction with AlphaFold, Nature, vol. 596, no. 7873, pp. 583–589, Aug. 2021, doi: 10.1038/s41586-021-03819-2.
- Rafael Giordano Viegas, Ingrid B. S. Martins, Murilo Nogueira Sanches, Antonio B. Oliveira Junior, Juliana B. de Camargo, Fernando V. Paulovich, and Vitor B. P. Leite. ELViM: Exploring Biomolecular Energy Landscapes through Multidimensional Visualization. Journal of Chemical Information and Modeling 2024 64 (8), 3443-3450. DOI: 10.1021/acs.jcim.4c00034
- D. J. Wales, M. A. Miller, and T. R. Walsh, Archetypal energy landscapes, Nature, vol. 394, no. 6695, pp. 758–760, Aug. 1998, doi: 10.1038/29487
- J. Ros, A. Arleo, R. G. Viegas, V. B. P. Leite and F. V. Paulovich, Challenges and Opportunities for the Visualization of Protein Energy Landscapes, in IEEE Computer Graphics and Applications, vol. 45, no. 5, pp. 49-63, Sept.-Oct. 2025, doi: 10.1109/MCG.2025.3592983
Details
- Supervisor
-
 Fernando Paulovich
- Secondary supervisor
-
 Jaume Ros
- Interested?
- Get in contact