Project: Understanding Dimensionality Reduction Projections using Explainable AI
Description
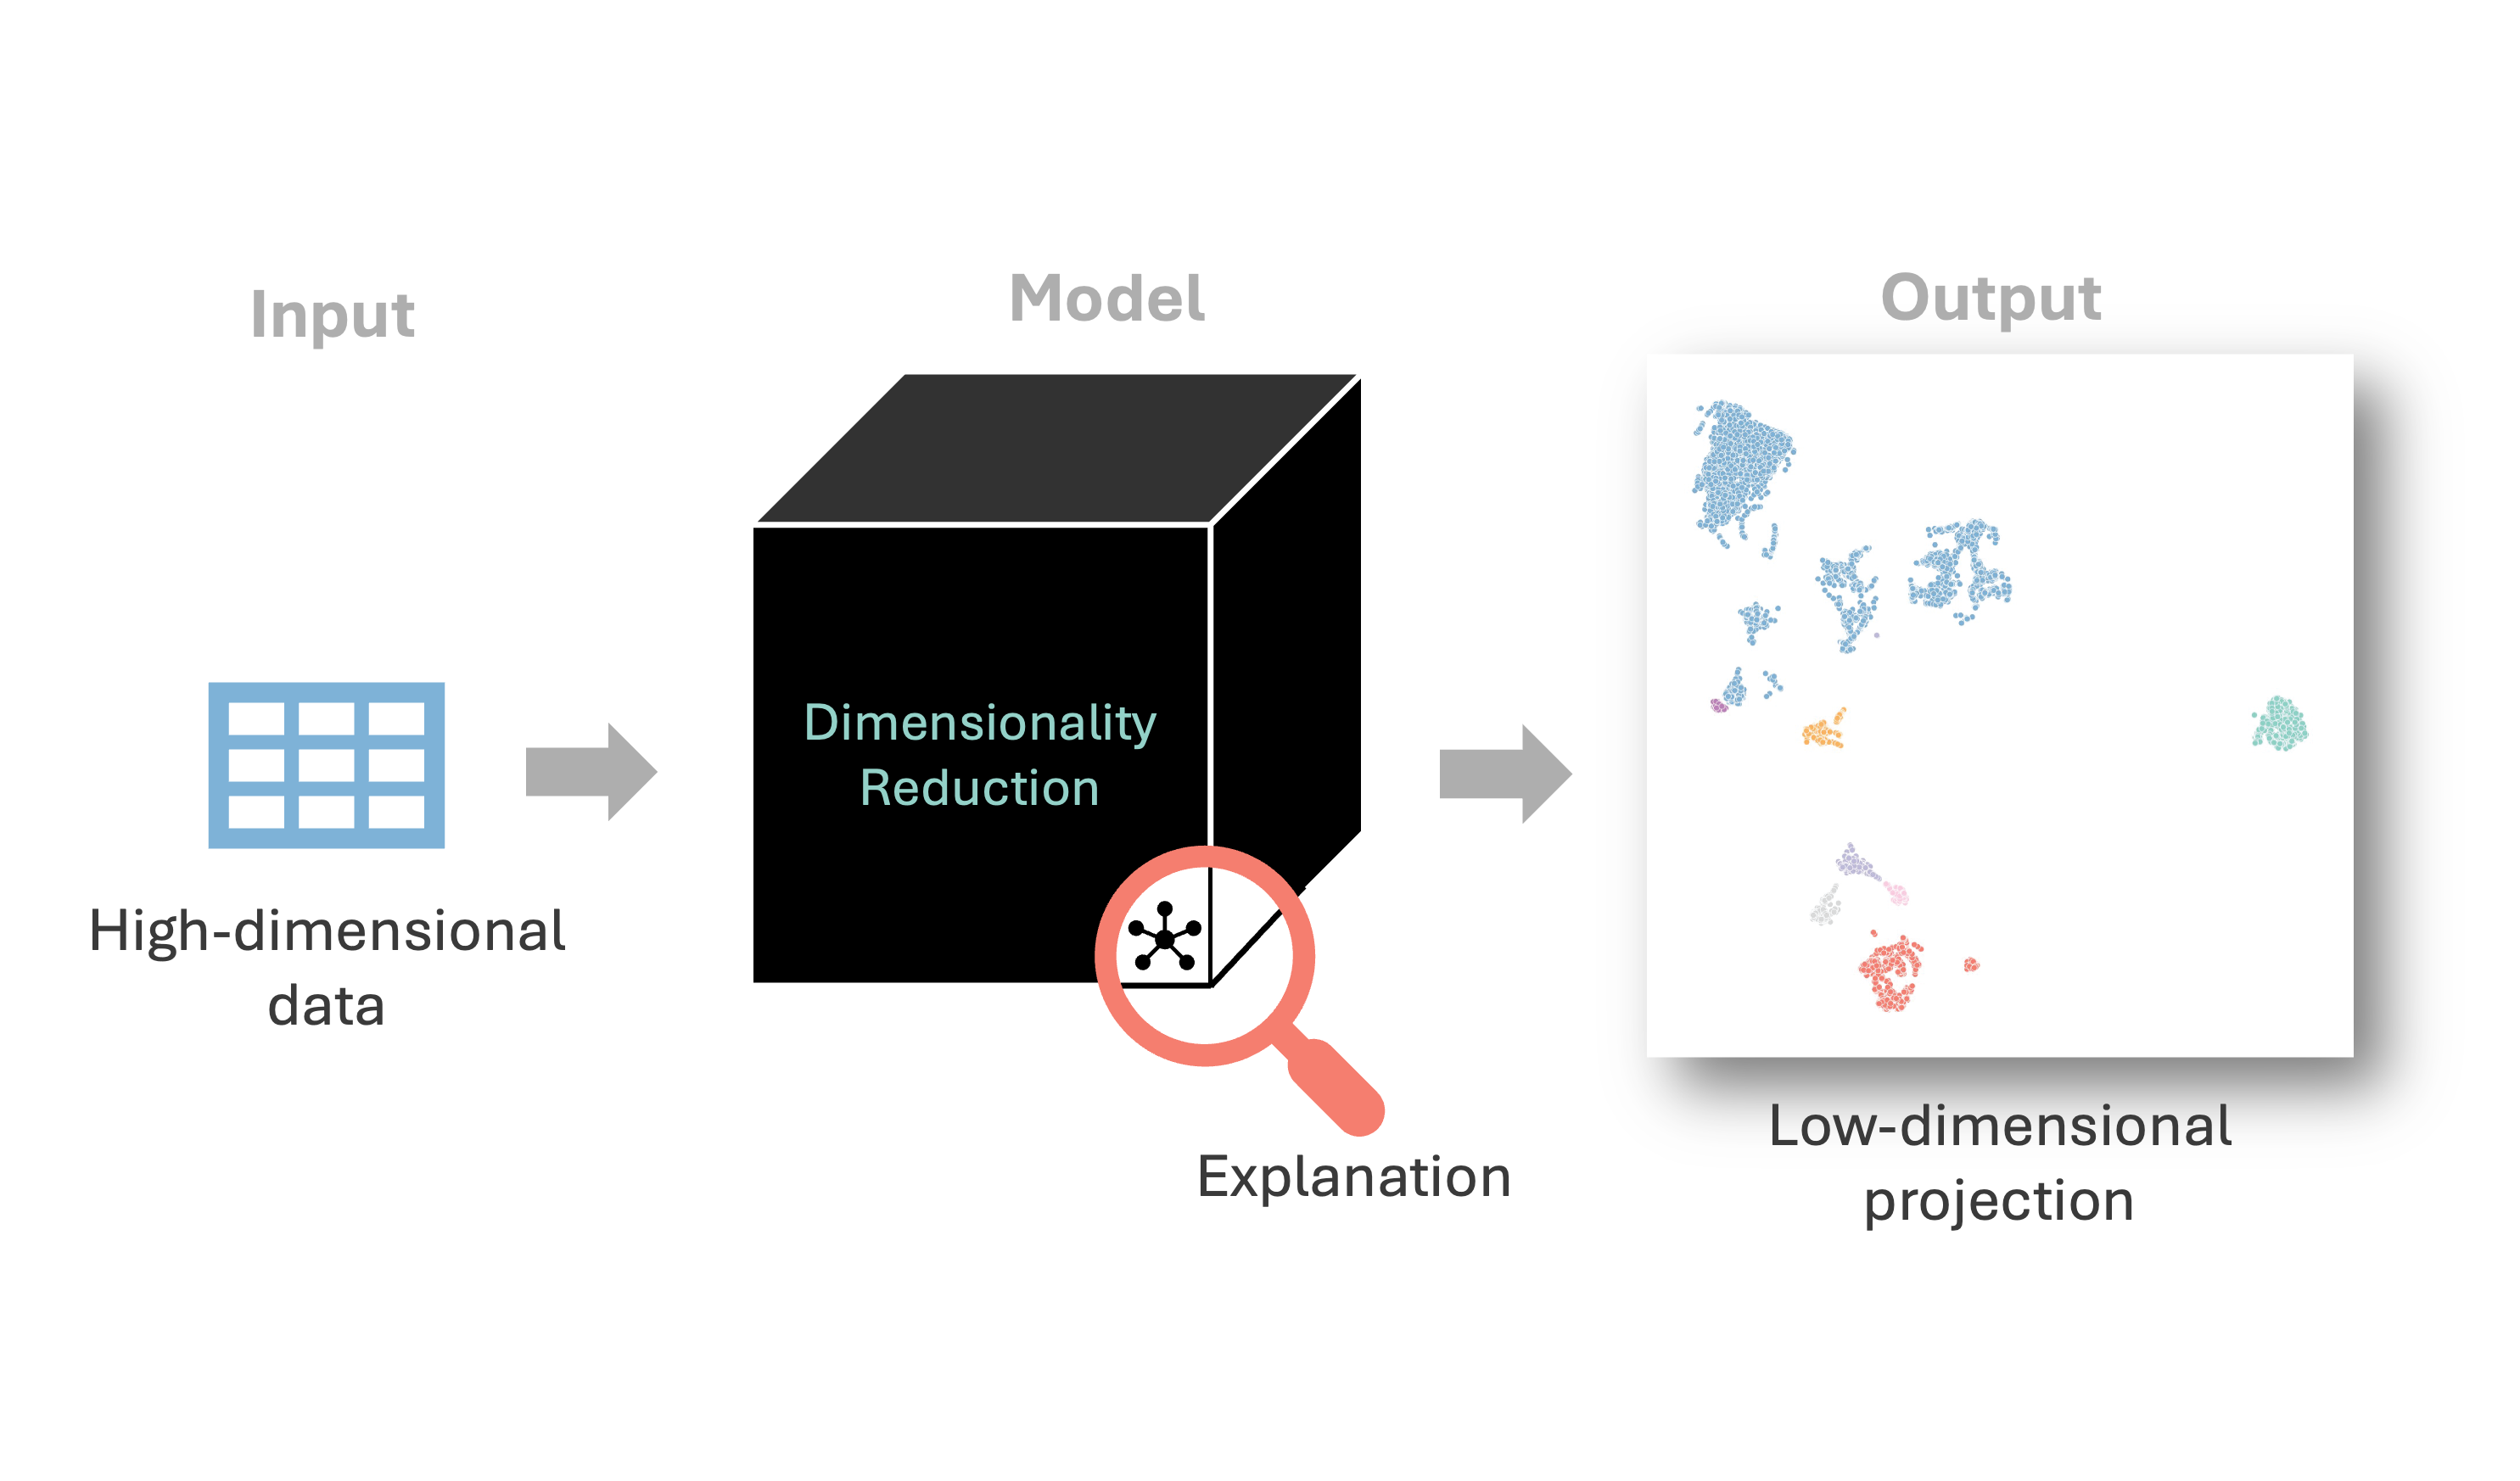
Dimensionality Reduction (DR) techniques such as t-SNE and UMAP are widely used to explore and visualize high-dimensional data in many different domains. Not only are these techniques popular in the fields of visualization and Visual Analytics, but they are also widely used in single-cell analysis, protein folding research, and drug discovery. Their popularity stems from their ability to reveal hidden structures, clusters and patterns that would otherwise be difficult to detect.
However, despite their usefulness, these techniques are largely opaque: users are shown compelling visualizations without any clear explanation of how or why the data points are positioned the way they are. When DR techniques are treated as black boxes, it is difficult to trust the insights derived from them, to identify which original features drive the observed patterns or to understand why a DR technique creates a particular projection. This problem can be framed similarly to explainable AI (XAI). In XAI, the goal is to explain how a model maps inputs to outputs. DR techniques can be viewed analogously as models that map high-dimensional data to low-dimensional projections.
Work on explainable DR exists. For example, DimReader [1] explains how features in the original data affect the projection, while gradient-based explanations [2] attribute embedding changes to input features. Other approaches focus on explaining clusters such as DimVis [3], which uses a contrastive model to explain clusters within DR projections, or use feature attribution methods such as Shapley values to explain how input features contribute to the observed projection and cluster structure [4]. These methods are often technique agnostic, potentially overlooking how different DR techniques construct their projections. Therefore, in this project, we will work on creating explainable DR for graph-based DR techniques such as UMAP, helping to improve interpretability and increasing trust in the resulting visualizations.
References:
1. Faust, R., Glickenstein, D., & Scheidegger, C. (2018). DimReader: Axis lines that explain non-linear projections. IEEE transactions on visualization and computer graphics, 25(1), 481-490.
2. Marcílio-Jr, W. E., & Eler, D. M. (2021). Explaining dimensionality reduction results using Shapley values. Expert Systems with Applications, 178, 115020.
3. Salmanian, P., Chatzimparmpas, A., Karaca, A. C., & Martins, R. M. (2024). DimVis: interpreting visual clusters in dimensionality reduction with explainable boosting machine. arXiv preprint arXiv:2402.06885.
4. Corbugy, S., Marion, R., & Frénay, B. (2024). Gradient-based explanation for non-linear non-parametric dimensionality reduction. Data Mining and Knowledge Discovery, 38(6), 3690-3718.
Details
- Supervisor
-
 Diede van der Hoorn
- Secondary supervisor
-
 Fernando Paulovich
- Interested?
- Get in contact