Project: Visual Analytics for Large‑Scale Mobility Data
Description
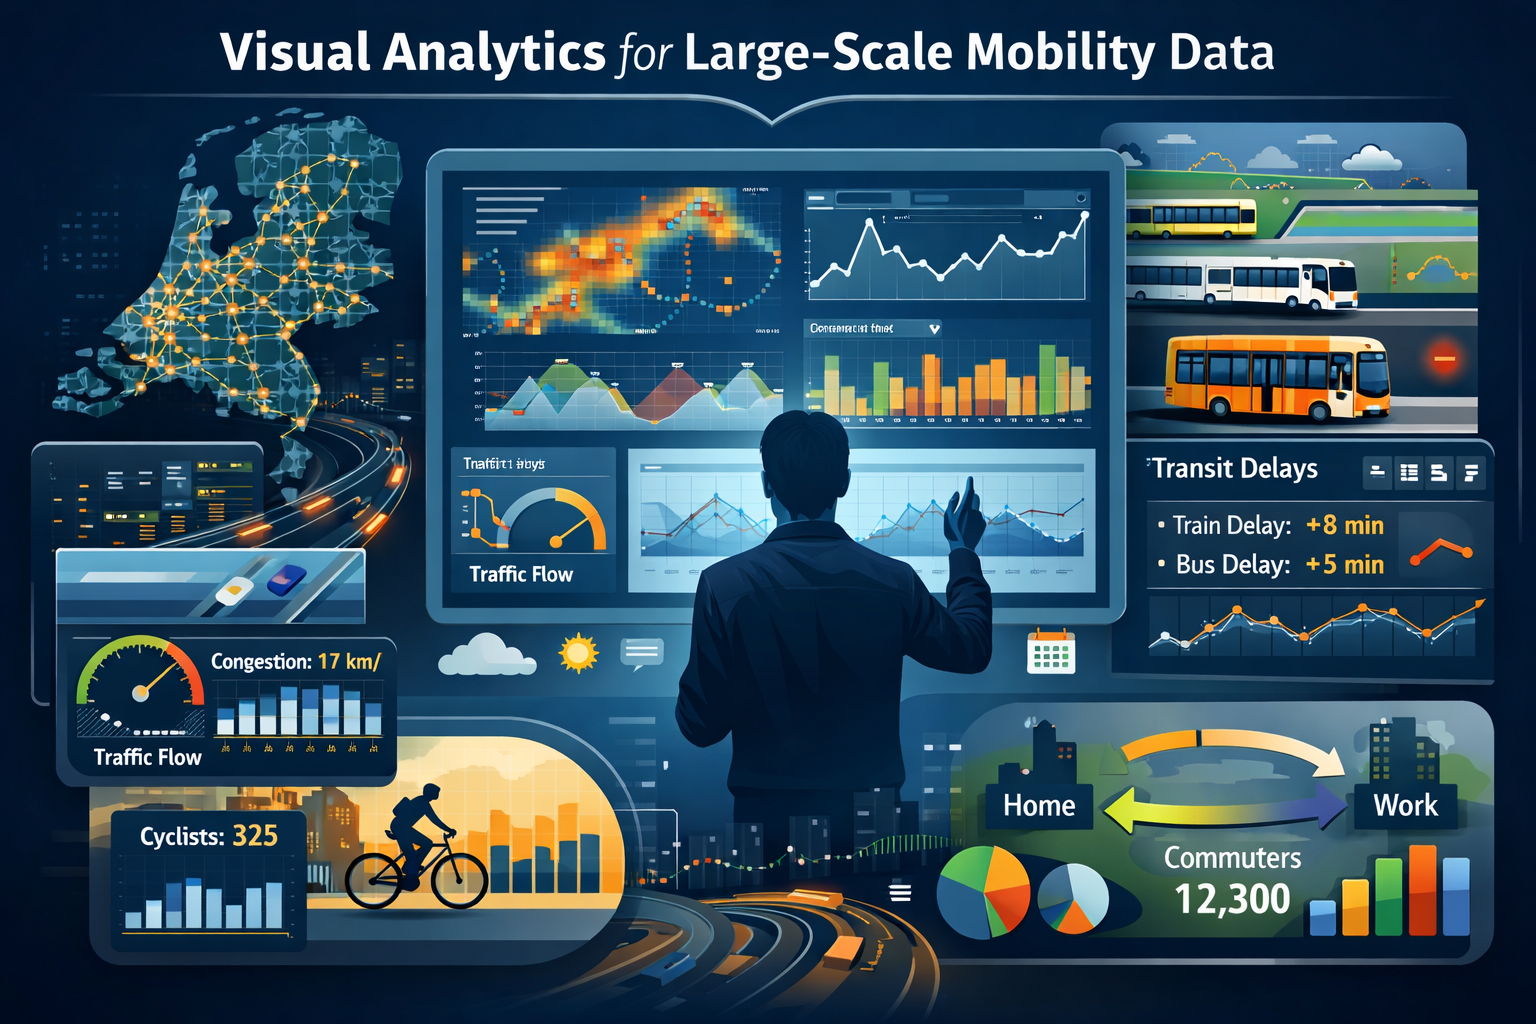
This project focuses on designing and evaluating a Visual Analytics (VA) system for exploring and understanding large‑scale mobility datasets. The goal is to develop an interactive VA tool that supports pattern discovery, anomaly detection, and interpretation of mobility dynamics in the Netherlands.
* Develop a data processing pipeline for a large, real‑world mobility dataset.
* Design interactive visualizations that reveal temporal, spatial, and behavioral patterns, paying attention to choosing proper visual encodings and interactions to best support exploratory analysis for this dataset?
* Support exploratory analysis through coordinated views, filtering, and brushing.
* Enable the identification of anomalies, trends, and contextual factors (e.g., weather, events, infrastructure).
* Evaluate the VA system with real analytical tasks and reflect on insights gained.
Possible datasets are:
* NDW traffic sensors — high‑volume, minute‑level traffic flow data
* FietsTelweek bicycle counts — urban cycling intensity data
* OpenOV public transport — nationwide transit schedules and real‑time delays
* ...
Depending on the chosen dataset possible domain questions to be solved are:
* What spatio‑temporal patterns emerge in the mobility data?
* Which anomalies or disruptions can be detected, and how do they propagate?
* How do mobility patterns vary across locations, time periods, or external conditions?
Details
- Supervisor
-
 Huub van de Wetering
- Interested?
- Get in contact