Project: Understanding Dimensionality Reduction Results with Interactive Decision Trees
Description
Dimensionality reduction (DR) techniques such as UMAP and t-SNE are widely used to project high-dimensional datasets into two-dimensional visualizations. These projections help analysts visually identify clusters, trends, and outliers in complex datasets. However, interpreting why specific groups appear in the projection remains difficult. While analysts can visually recognize patterns, understanding which underlying data attributes are responsible for the observed structures is often unclear. This lack of interpretability limits the usefulness of DR techniques in exploratory analysis, especially in domains where explainability is important.
Recent work in
explainable AI and interactive visualization has shown that combining machine
learning models with visual interaction can help users better understand
complex analytical results. Decision trees, in particular, provide
human-readable rules that describe differences between classes and are
therefore promising candidates for explaining selections made within DR
projections.
Focus of the Project
This project
investigates how interactive decision trees can support the interpretation of
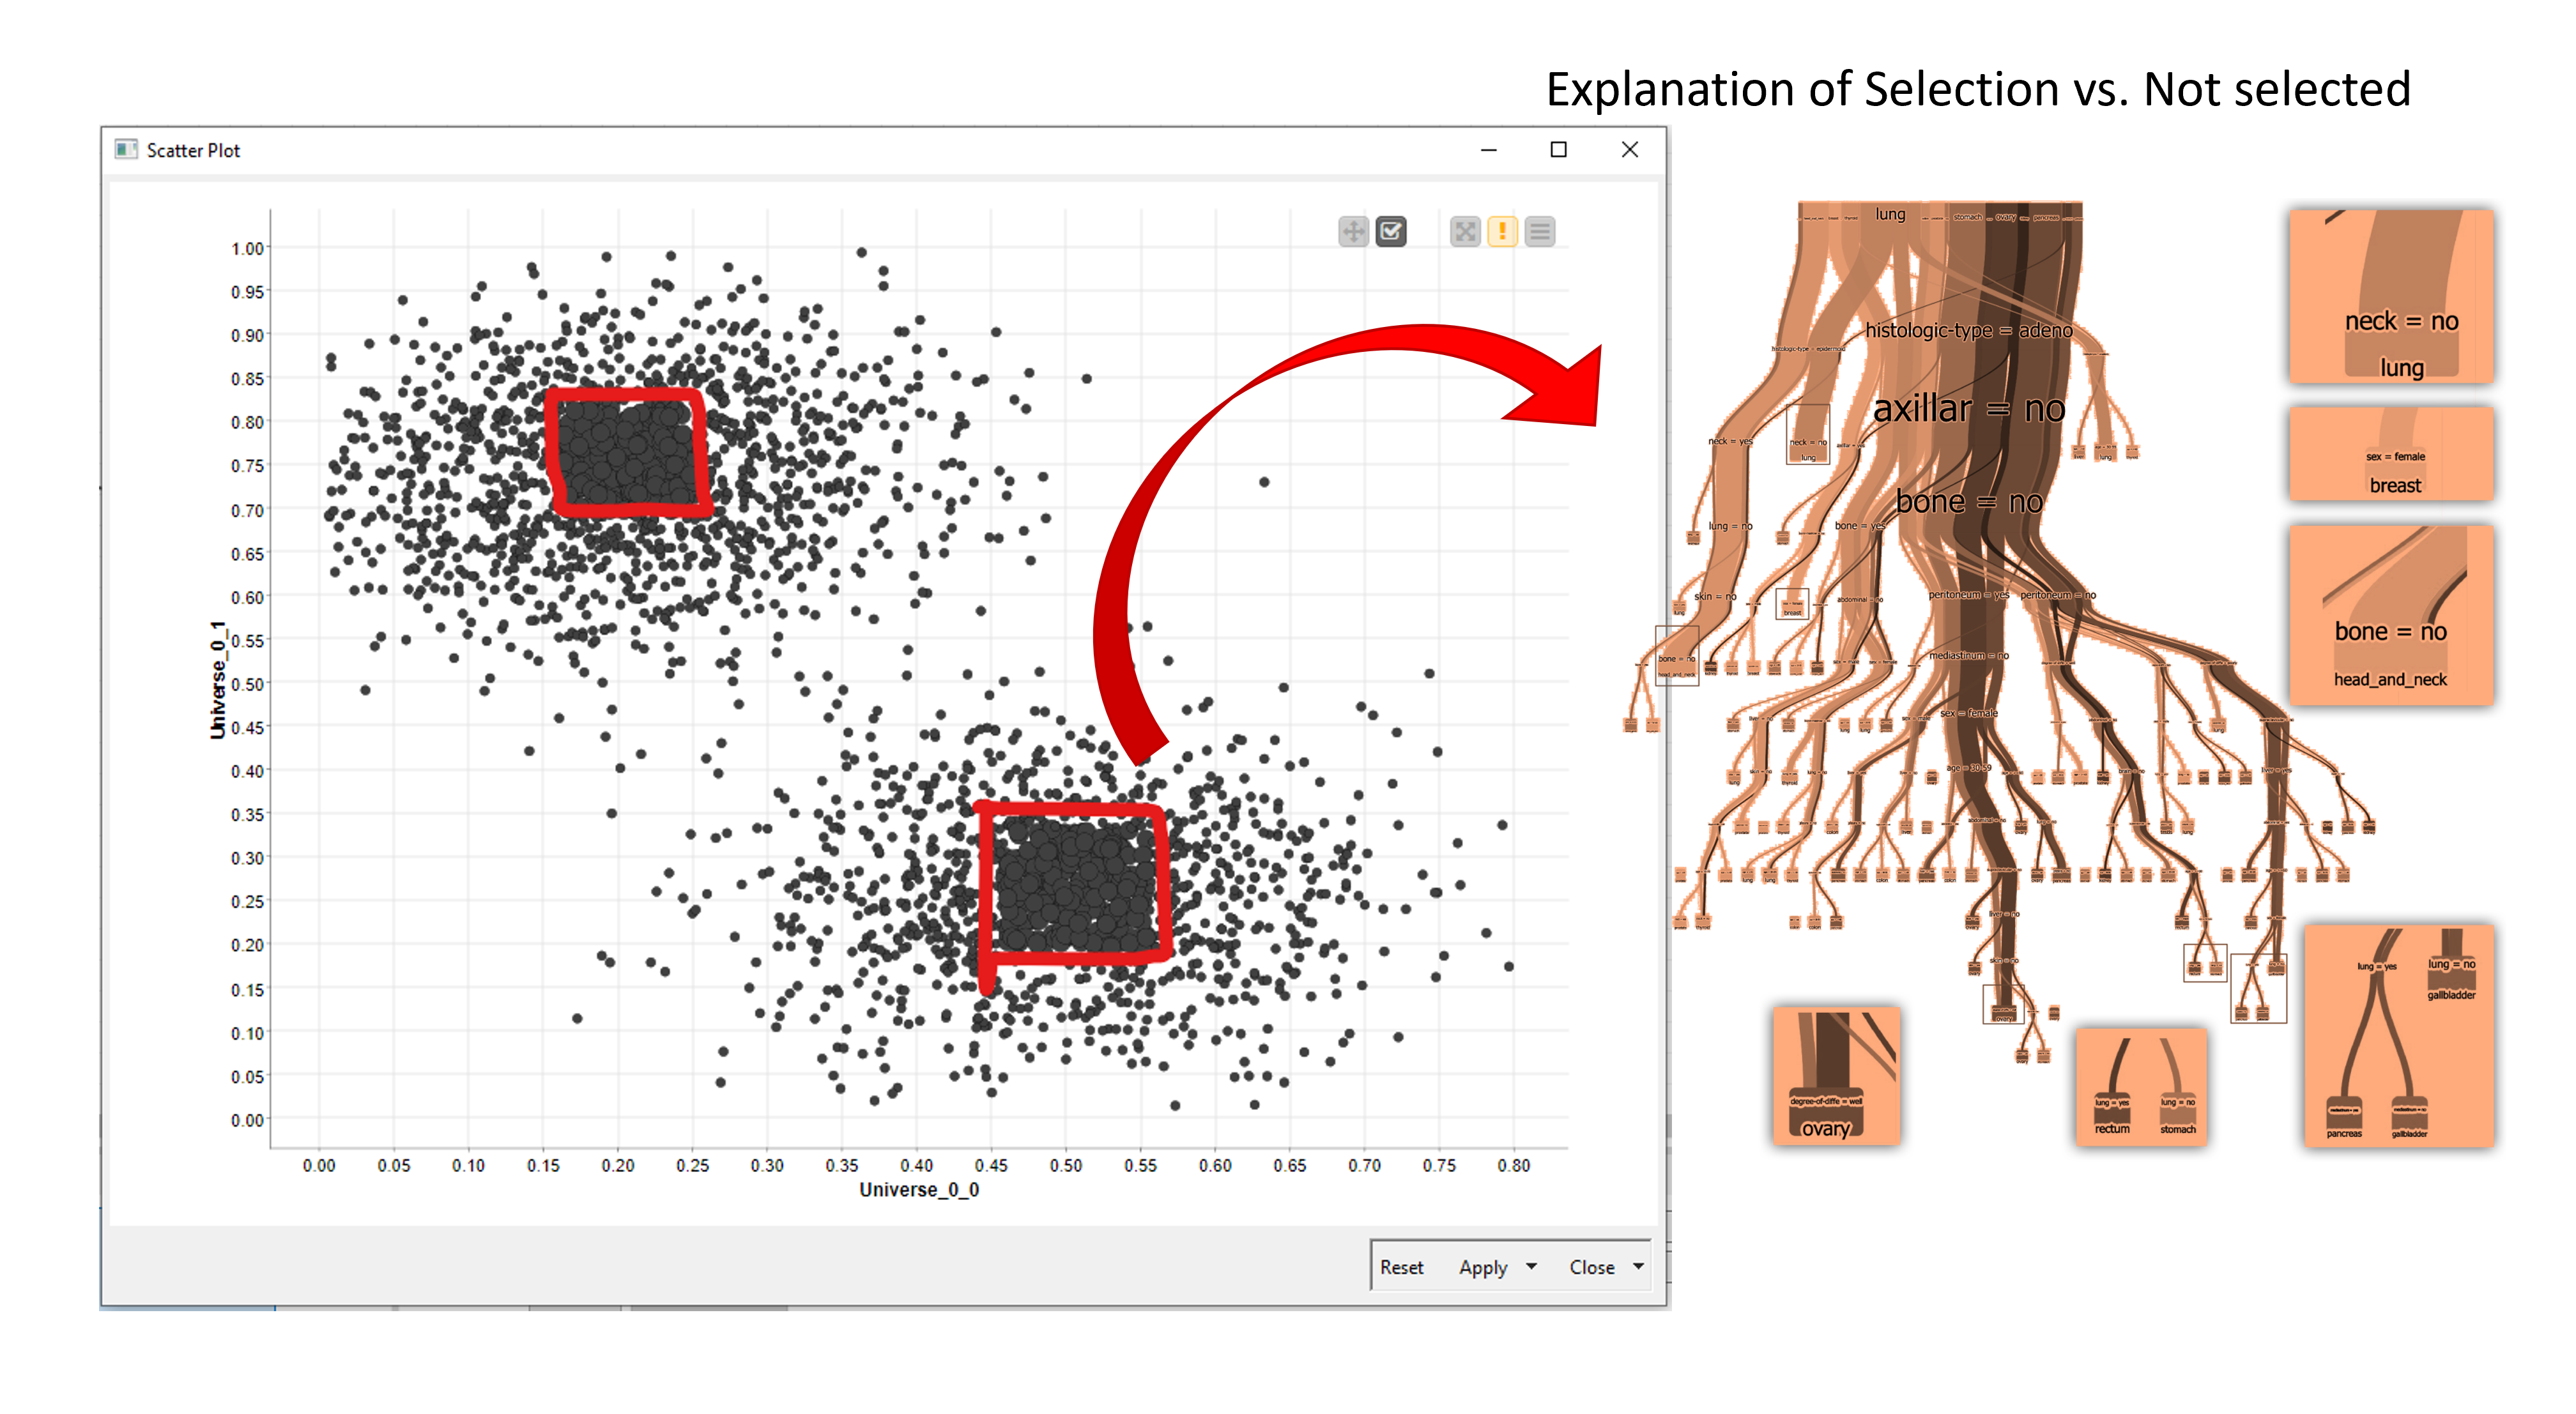
dimensionality reduction results. The core idea is that a user interactively
selects a group of points within a DR visualization (e.g., a cluster in a UMAP
projection). The selected and non-selected points are then treated as two
separate classes, after which a decision tree classifier is generated to
distinguish between them.
The project
focuses on designing and implementing an interactive visual analytics prototype
that tightly integrates DR visualizations with decision tree explanations.
Important research questions include:
- How can user selections in DR projections be
effectively translated into interpretable classification models?
- How can decision tree structures be visually integrated
with DR views?
- How understandable and useful are the generated
explanations for analysts?
Possible extensions include comparing different explanation strategies, supporting iterative refinement of selections, or exploring how stable the explanations remain under varying DR parameters.
The project is expected to last 6 months, and at the end, the
student should deliver a report describing the work performed, the methodology
used, and corresponding findings. It is expected that the results can be used
in a scientific journal publication.
Requirements:
- Good programming skills
- Visualization knowledge on design-centered approach (e.g.,
Munzner)
- Ability to use and apply ML models
Details
- Supervisor
-
 Stef van den Elzen
- Interested?
- Get in contact