Project: Interactive Visual Analytics for Temporal and Cohort-Level Counterfactual Explanations
Description
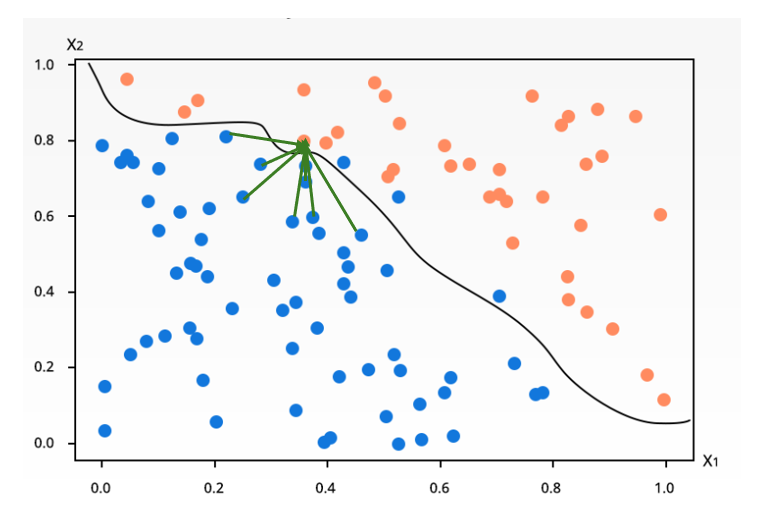
Time series data capture not only the current state of a system but also its evolution over time. The usage of machine learning and deep learning models while achieving high predictive performance also makes the solution opaque due to the black-box nature of the models. Even though Explainable AI (XAI) offers a promising direction, there are several additional challenges due to the temporal and multi-variate nature of the (time series) data.
Within XAI, counterfactual explanations have drawn increasing research attention due to their similarity with human reasoning, actionability and model-agnosticism. The existing literature on counterfactual explanations, tabular and time series, focus at an instance level producing point-estimate counterfactuals with no temporal structure and connection to global level evidence. Cohort-Level counterfactual explanations where many similar data points are associated with a single representative alternative trajectory are proposed as a solution to both the lack of a temporal structure as well as lack of global evidence. Additionally, Visual Analytics systems have been developed to support the exploration and interpretation of counterfactual outputs, currently limited to tabular data.
This thesis tackles the intersection of these problems - developing an interactive Visual Analytics framework for exploring cohort-level counterfactual explanations in time series prediction models. In fact, the complexity of this problem which helps understand what minimal change to flip the prediction, is necessary for a pre-determined subset of the data and its timestamp, necessitates a framework that enables easier understanding and exploration, making Visual Analytics the obvious choice.
Details
- Student
-
TCTi Jung Chen
- Supervisor
-
 Alessio Arleo
- Secondary supervisor
-
 Sharadhi Suryanarayana