back to list

Project: Visualization of dense temporal events
Description

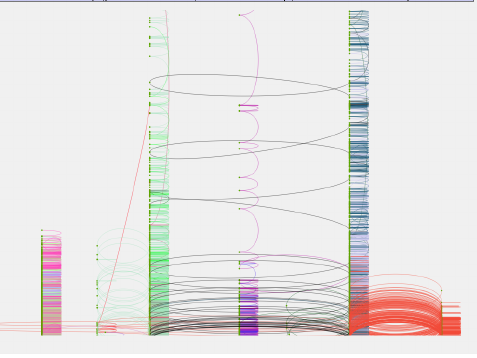
In this thesis, an approach to visualizing dense temporal events is investigated. When events are densely packed together, the resulting issues are highlighted and techniques to alleviate them are presented. The visualization developed enables uncovering interesting patterns hidden in such dense temporal data. The pros and cons of using splines versus straight lines for representing dense temporal events are discussed at length. Different datasets like software traces dataset, an earthquake data-set, a coral reef disease data-set and a ferry data-set are utilized in order to test the performance of straight lines against splines.
Details
- Student
-
SDSupriya Dsouza
- Supervisor
-
 Huub van de Wetering
- Link
- Thesis