Project: Visualization of potato genome sequencing data
Description
Improvements in DNA sequencing techniques confront researchers with ever growing datasets, which have to be processed and annotated. Advances in computer power and graphical hardware have made it possible to visualize and explore genome size datasets on inexpensive personal computers. But the visualization of datasets of these sizes is no trivial task for a biologist or even bioinformatician.
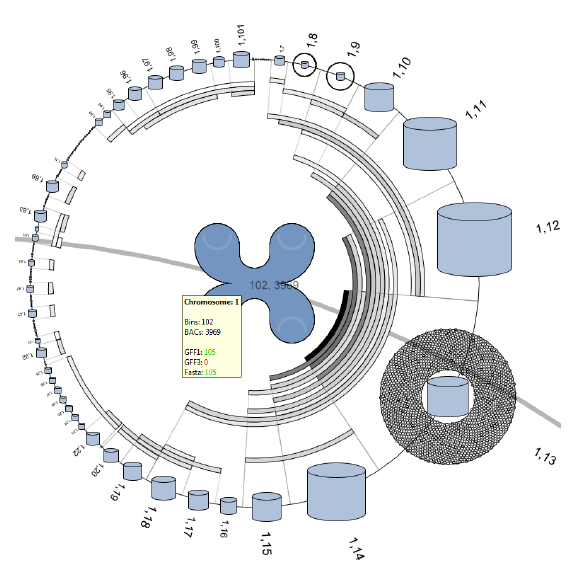
This Master project tries to create a responsive visual interface that allows for the exploration of genome size datasets. This report describes the development and research of two contrary approaches of visualizing of these kinds of datasets. The first approach uses the high level DNA structure to provide an interface to the low level sequence and annotation data. The second approach focuses on the visualization of the low level annotation data, and tries to provide an interface to visualize the complete set of annotations within the dataset. Both visualization approaches are implemented as extensions to the DNAVis2 sequence browser.
Details
- Student
-
RBRemco van Brakel
- Supervisor
-
 Huub van de Wetering
- Secondary supervisor
-
 Jack van Wijk
- Link
- Thesis