Project: JuxtaSet: visualization of time-varying patterns and missing data
Description

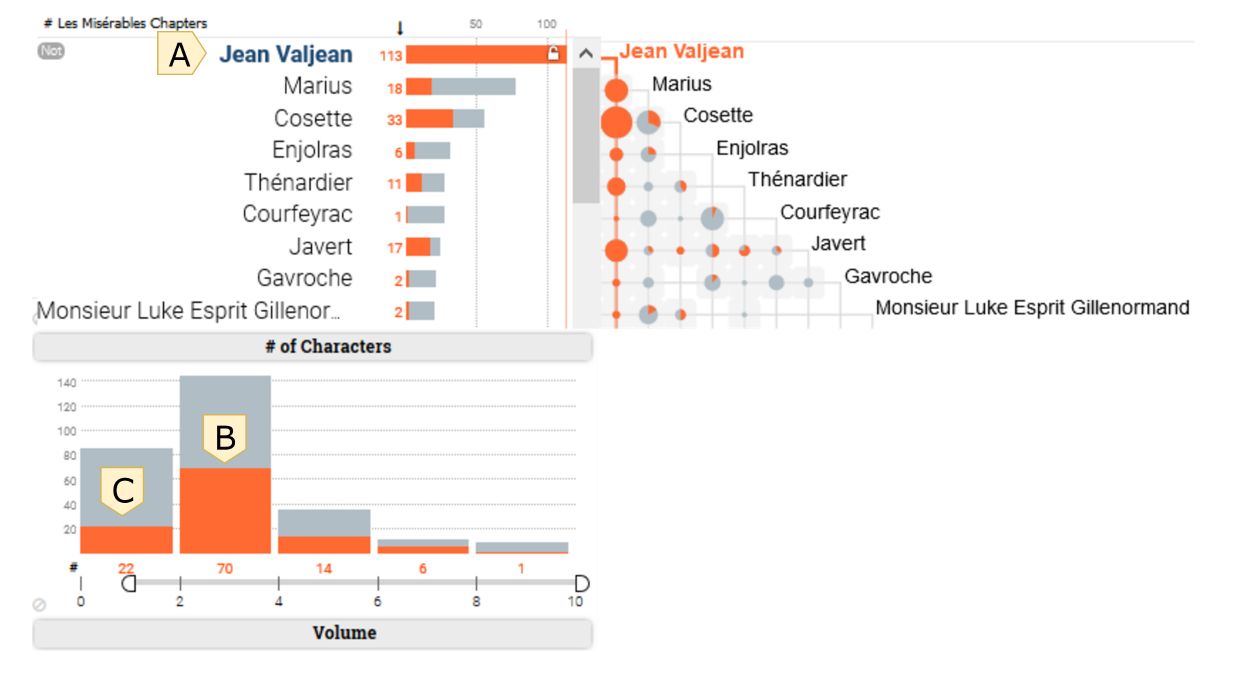
Epidemiologists need to monitor complex resistance patterns of multi-drug resistant bacteria, and especially since bacteria are increasingly resistant to antibiotics. Their analysis, however, is limited to individual antibiotics. Hence, epidemiologists want to gain more insight in multi drug resistance patterns and their relations with other attributes. The multivariate nature of the antibiotic susceptibility testing data and a multitude of missing data complicates this task. A new visualization system is designed that allows for rapid exploration of these patterns.These patterns are combined patterns and exact patterns. Combined patterns and exact pat-terns are intersecting sets and exclusive set intersections in set terminology respectively. Using JuxtaSet, users can quickly analyze combined and exact patterns, and monitor data over time.Moreover, the users can ascertain how trustworthy the imputation of the data is, and they can getin sight in attributes. JuxtaSet visualizes combined and exact patterns accompanied by spark lines depicting temporal fluctuations. Imputation of missing data is visualized as aggregates, and as distinct patterns on demand. Additional attributes are visualized with interactive bar charts. It uses scrollable non-overlapping matrix layouts to increase scalability and with linked highlighting,attributes and patterns can be explored. Epidemiologists at the Netherlands National Institute for Public Health and the Environment have shown during evaluation that JuxtaSet gives insight into these complex data in a convenient and user-friendly way. Given some practice or explanation,they were able answer relevant questions to their expertise.
Details
- Student
-
NDNiels Drost
- Supervisor
-
 Jack van Wijk
- External location
- RIVM - Bilthoven
- Link
- Thesis