Project: City traffic visualization
Description
Sooner or later every modern city faces the challenges to cope with increased traffic and street congestions. Increased e-commerce means an increase in the number of delivery trucks driving around. Understanding how a city works can be used by researchers and governments to enforce new policies for regulating the traffic. Because of this, cities are pioneering with creating measuring sites that collect traffic data for further analysis. NDW is relatively young and fast developing system that collects and stores such data for the major roads around the Nederlands. Unfortunately there still haven’t been many applications that can present the data in easy to understand and analyze format. Furthermore, the few products that have been released are aimed to be commercial oriented rather than research helping.
This thesis describes an interactive visualization of NDW traffic data. We designed and
built a prototype that does has two main functions. First, it cleans the raw NDW data. We
remove the unnecessary information and organize the rest in a more useful to us matter. This
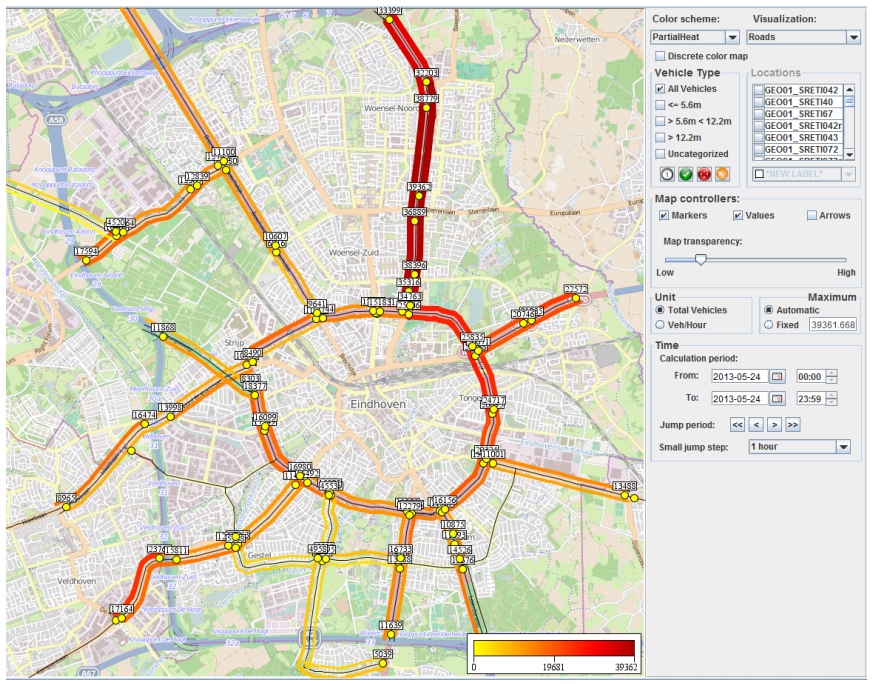
gives a vast reduction in used memory storage space. Second, we created various types of
visualizations: visualizing traffic data over a geographical image and visualization using line
and bar charts. The first type of images allow the exploration of the spatial property. The
user can see the traffic situation in a whole city for any period in time. Charts assist the
user in understanding the vast amount of data. Multiple controls are provided to change
the dimensions such as temporal properties, vehicle class, location, etc. Finally we combine
everything in a multi user system.
Details
- Student
-
VDValcho Dimitrov
- Supervisor
-
 Jack van Wijk
- Link
- Thesis