Project: Medicine prescription visualization
Description

Electronic patient data and medical prescription histories are a valuable source of information. Doctors want to use this data to get more insight into their prescription behavior and that of their colleagues. Up till now, there is no suitable system that shows information about multiple doctors, patients, and medicines at the same time.
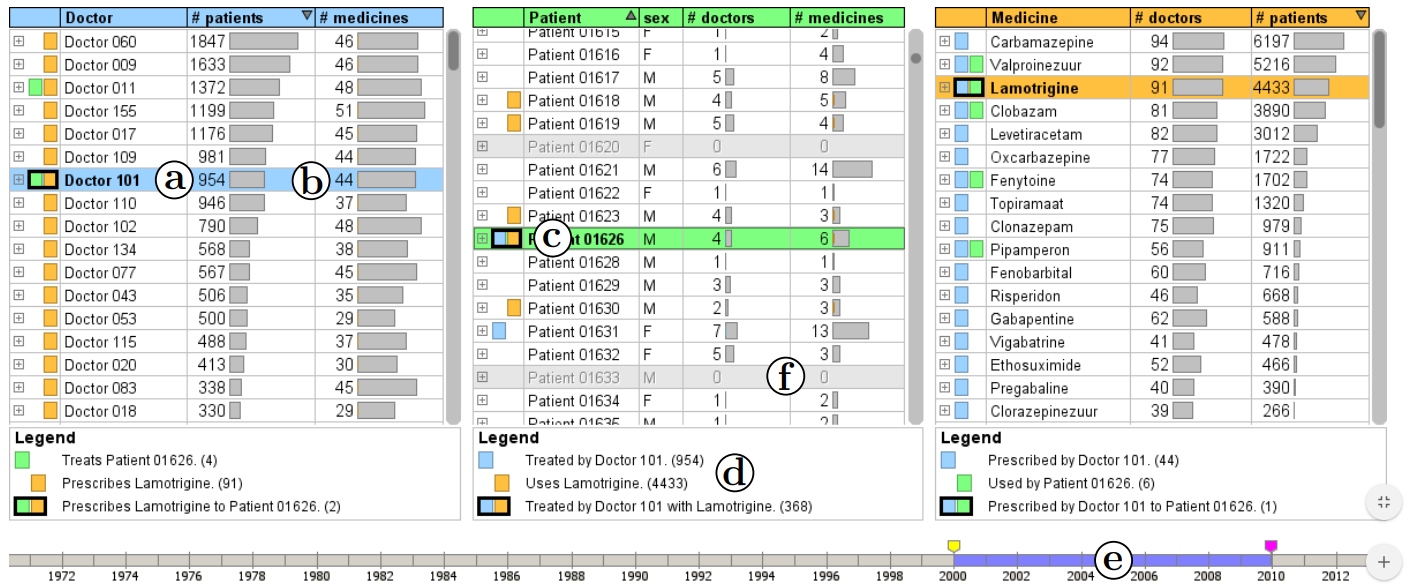
In cooperation with the Kempenhaeghe institute for epileptology, sleep medicine, and neurocognition, we developed an interactive visualization system that enables neurologists to explore their database which contains the hundreds of thousands of prescriptions made in the past three decades. The system offers doctors two tightly connected views on the data. First, there is a three table view that shows information about doctors, patients, and medicines; their relations; and how these evolve over time. Secondly, there is a prescription viewer that presents several aggregated prescription metrics in the form of histograms. A global timeline can be used to select only those prescriptions in the time interval of interest.
An evaluation session with six neurologists demonstrated that the developed system is accepted
very well by the target audience. After a short introduction of 15 minutes they were able to answer
complex questions about prescriptions within Kempenhaeghe with the help of the system. Despite
some minor issues with the interface regarding intuitiveness and precision, the neurologists are
looking forward to use the system in the future.
Details
- Student
-
PCPaul van der Corput
- Supervisor
-
 Jack van Wijk
- External location
- Kempenhaeghe - Heeze
- Link
- Thesis