Project: InfoCloud: improving business intelligence usage by socialization
Description
Business Intelligence tools are used by professionals to obtain knowledge about the organization they
work in which in turn is used to make good management decisions. One type of BI tools use visualizations
to make the data in the organizations’ databases more understandable and insightful. This report
describes how the usage of such a visualization BI tool can be improved. After interviewing professionals
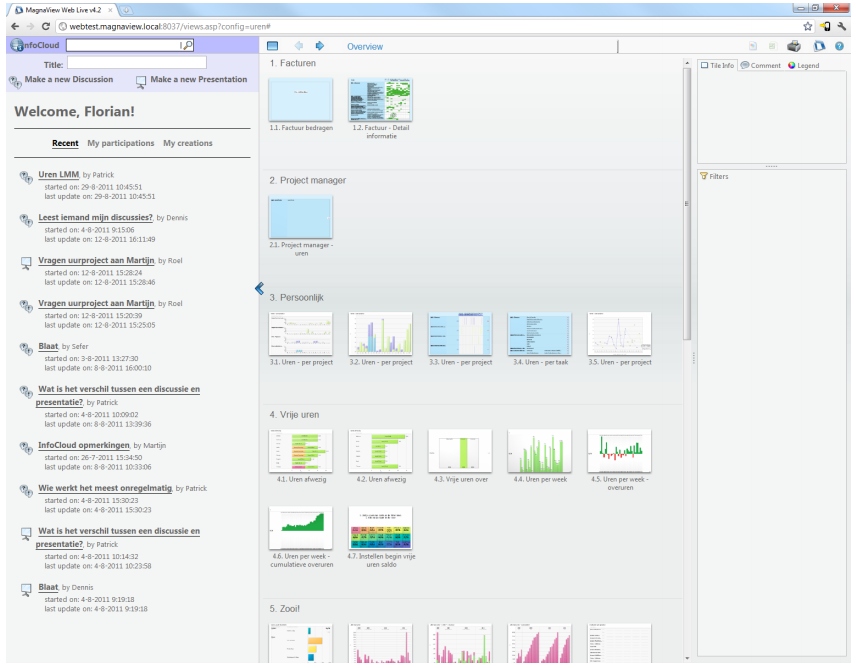
and studying related research the addition of a social component is chosen. The resulting prototype
in the visualization tool combines user comments with saved visualization states (called snapshots)
into discussions and presentations. This prototype has been user tested, which showed that combining
visualizations with discussions or presentations has its merit in an organization, that snapshots are a
powerful and precise medium of expression, reference and argumentation in such communication. Adding
a social component to a BI tool is deemed as a success, as it gives context, guidance and communication
to the visualizations and motivates the users.
Details
- Student
-
FWFlorian van der Wielen
- Supervisor
-
 Jack van Wijk
- External location
- MagnaView - Eindhoven
- Link
- Thesis