Project: Visualization of multivariate data: network monitoring data case study
Description
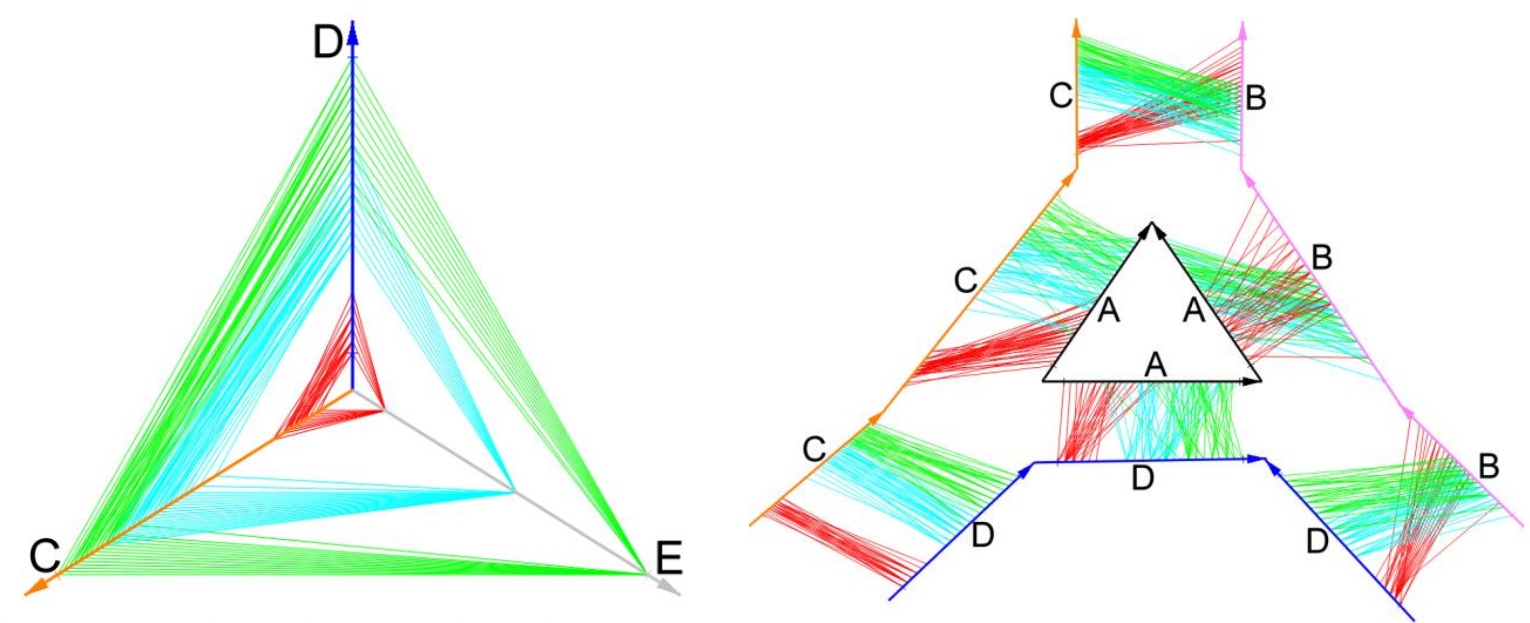
The ability to connect computers to one another, by means of a network, has led to computers being more vulnerable for malicious behavior. Network operators have the task to prevent attackers from performing malicious activities on their networks. In this thesis we present an extension to visualization techniques, providing added value for displaying network monitoring datasets. The resulting visualization technique is suitable for displaying multivariate data in general, hence not only applicable to network monitoring dataset.
The main enhancement made to the existing visualization techniques: flexibility, allows for layouts enabling
the user for easier and quicker identification of dataset characteristics, structures and outliers. We present
cases for several datasets where the introduced idea proved valuable, as well as an interface capable of
supporting the suggested visualization technique. The user study proved that the presented idea of Flexible
Linked Axes is considered useful. The visualization technique provides a solid base for dataset exploration
and investigation, and gave new insights to network monitoring experts during the investigating of their
datasets.
Details
- Student
-
JCJarry Claessen
- Supervisor
-
 Jack van Wijk
- Link
- Thesis