Project: Visualizing medical narratives from electronic health records
Description
The electronic health record was designed to assist doctors, but in hospitals in the US, a kidney patient has on average 338 notes. The medical narratives in these notes play a major role in providing contextual richness of a patient and clinicians rely heavily on these. Besides the notes, there are also quantitative data, such as the lab results. This overload can have negative consequences, from errors of omission to aspects regarding the patient’s safety.
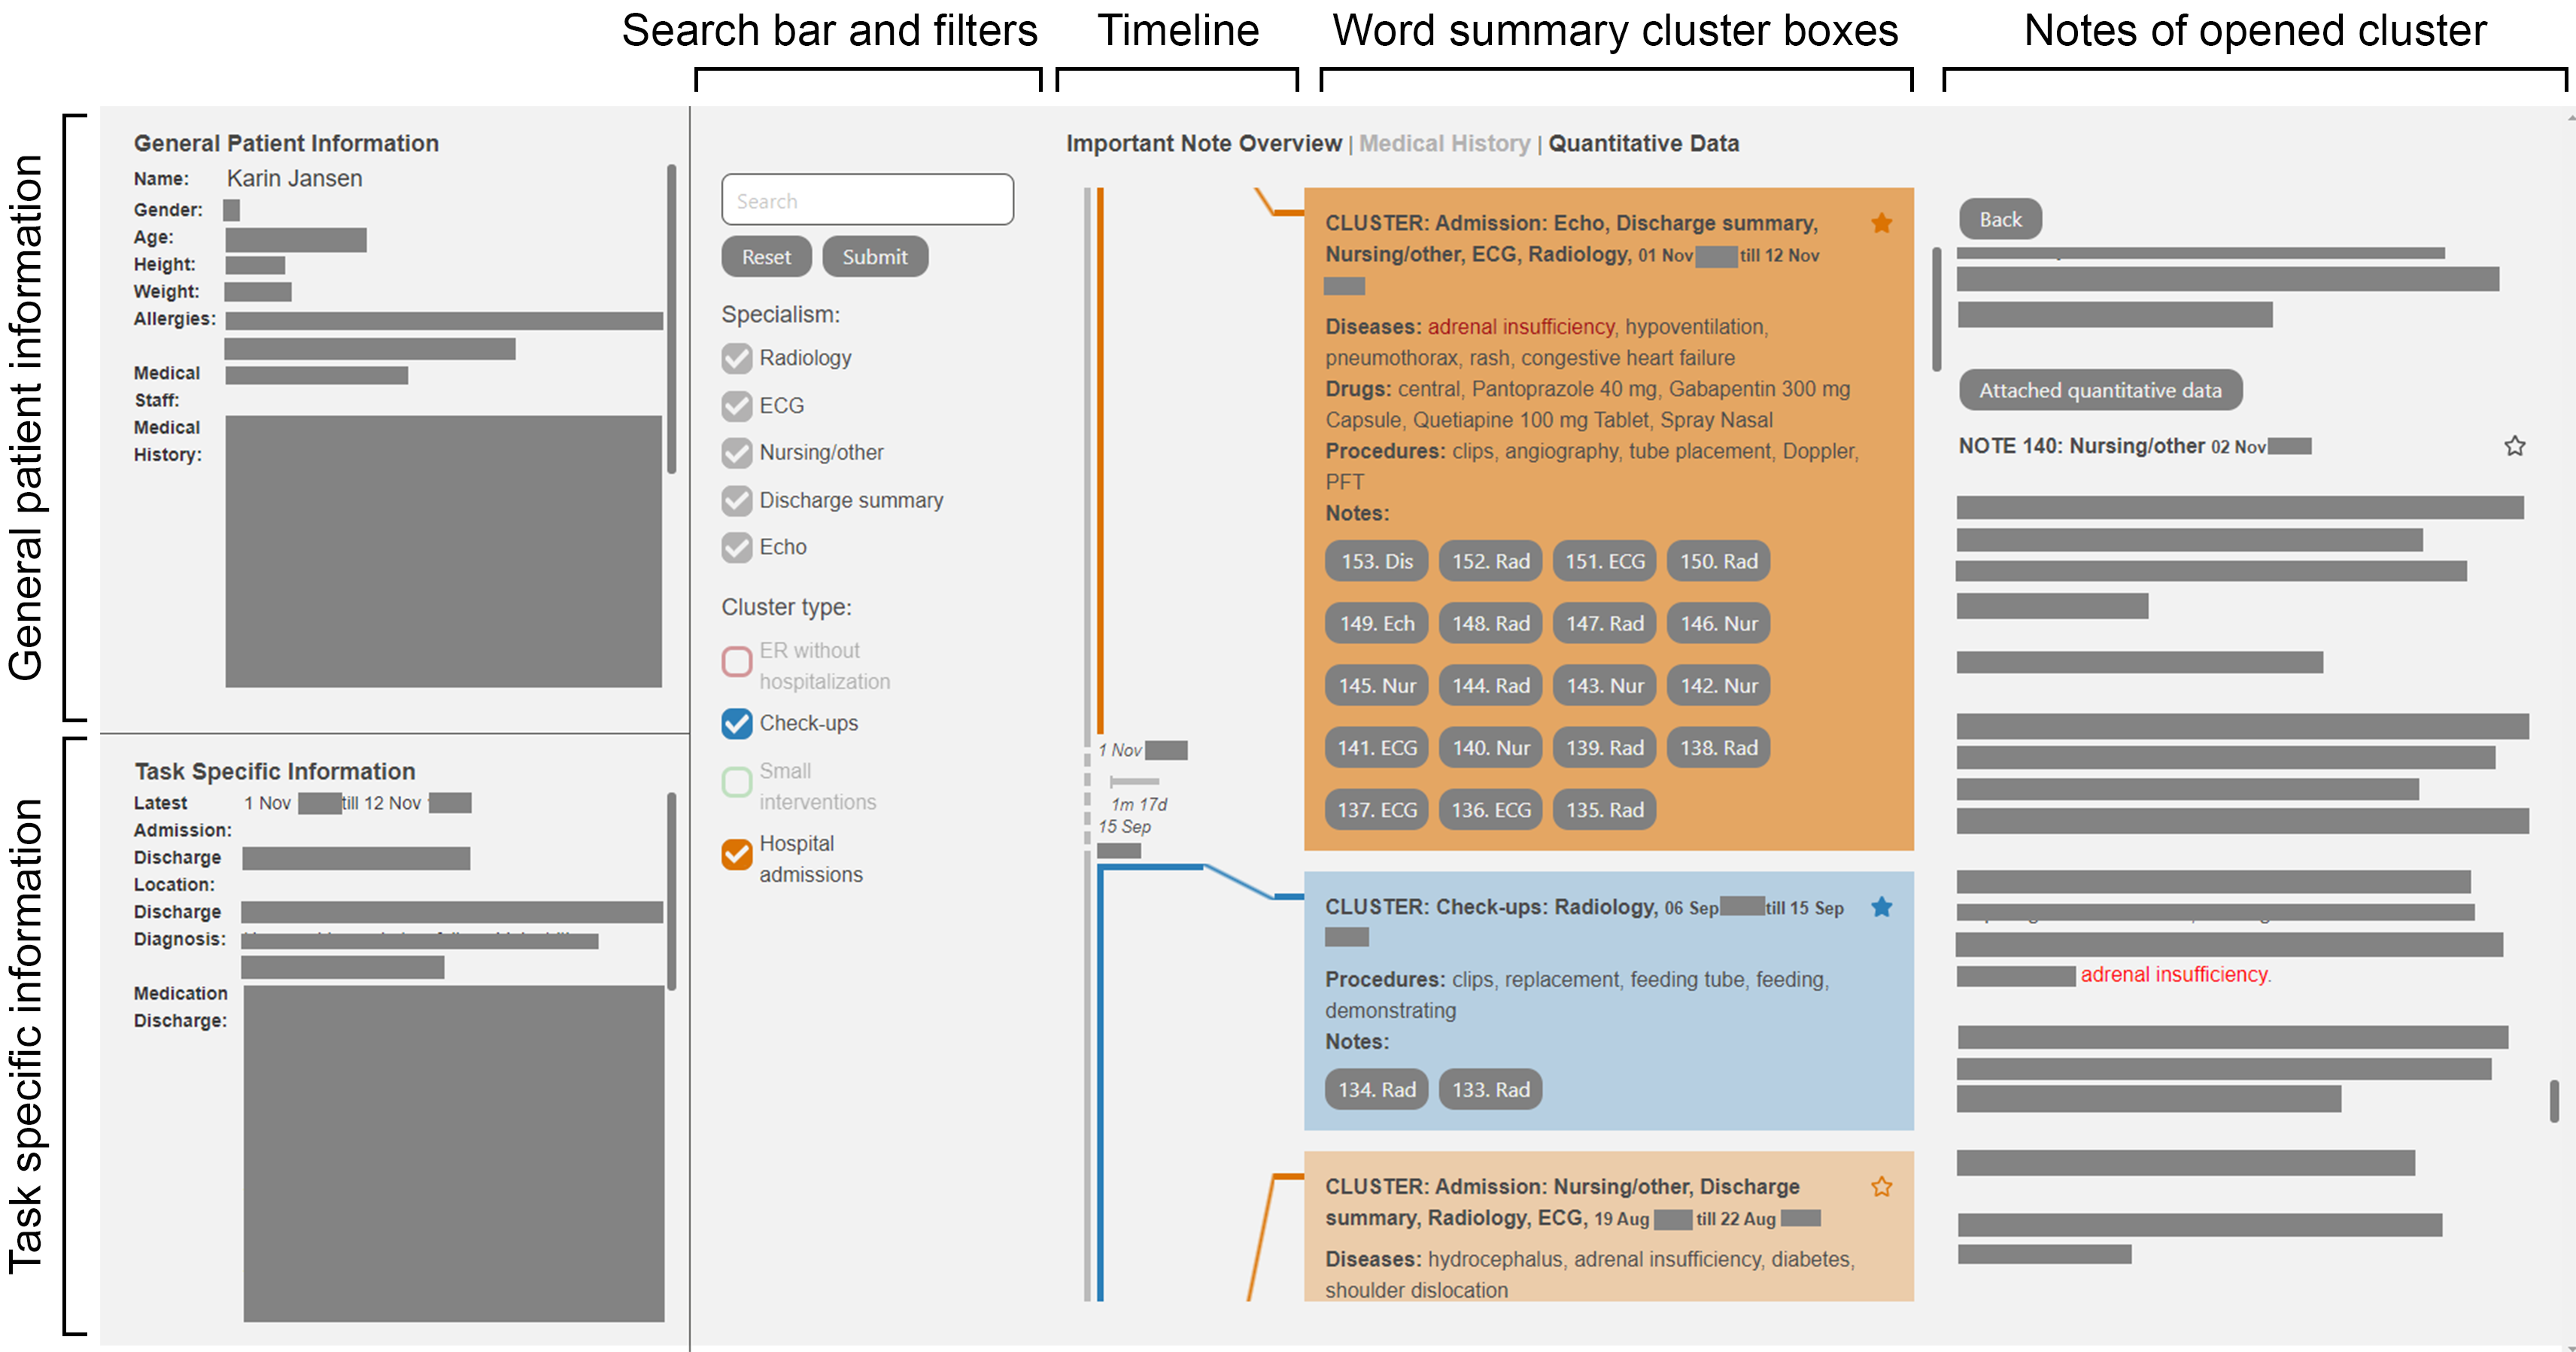
The contribution of this project is to reduce the cognitive load of forming these medical narratives for doctors based on the different tasks in their workflow. This is implemented by providing a visualization prototype that offers structured and task specific visualizations with different levels of detail. Also, the textual notes are used as the starting point and the quantitative data are linked to textual data. The prototype was made by collaborating with and tested by 18 doctors, 2 nurses and 14 experts. Participants ranked the visualization the highest in comparison to a simple list visualization and another version of this prototype with a slight variation. Moreover, the prototype could reduce the cognitive load. Although, the needed medical narratives were not completely extracted from the prototype, which was probably due to the data format.
Details
- Student
-
SLSanne van der Linden
- Supervisor
-
 Jack van Wijk
- Link
- Thesis