Project: Visualization of Deep Learning Networks
Description
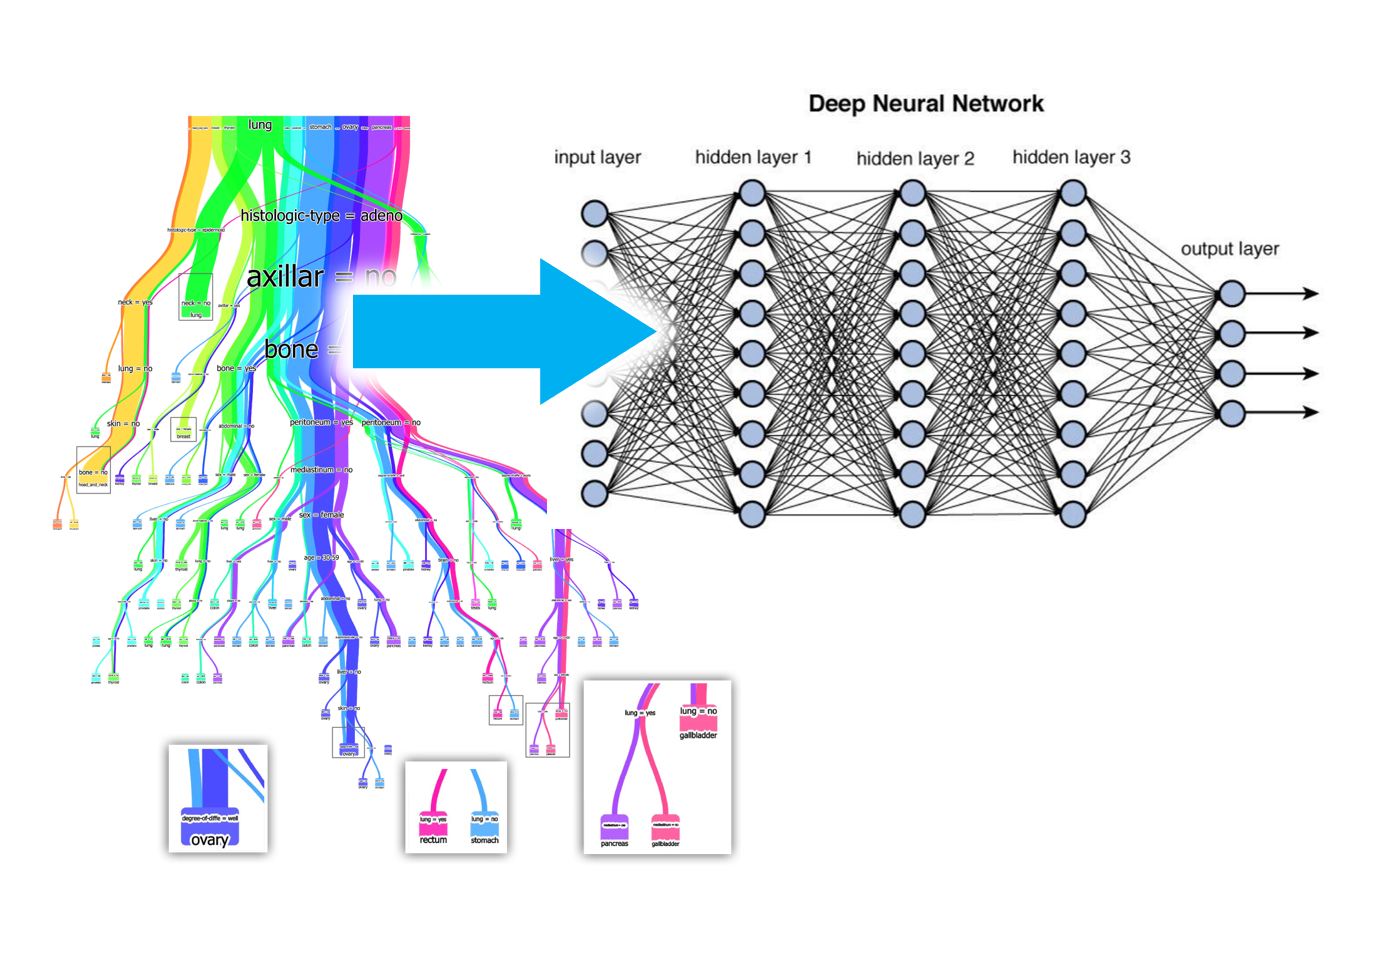
Deep learning networks are the state of the art in machine learning for various classification and regression tasks in many domains, e.g., machine vision, speech recognition, and, natural language processing. Deep learning models often outperform traditional machine learning models in terms of classification/regression accuracy. Often these deep learning models are complex, hard to train and hard to understand. This is not an issue if they are used as a black box model only providing the output in an automated process. However, to gain trust in the model we need to understand why the model makes certain predictions and also understand the incorrect predictions. This is both important for model improvement and transparancy towards the end user to increase trust in the predictions. For image classification tasks there are several methods to gain insight in the model, e.g., with deconvolutional networks [1] that project the learned feature space back to the pixel space so we gain insight in what features are learned at the different layers of the model. However, for generic multivariate data this problem becomes much harder, as we can no longer interpret the layers using this technique. For traditional machine learning models such as decision trees we can gain insight in the model by projecting the data directly onto the model, with for example sankey-like techniques [2]. In this project we want to explore how similar methods can also be applied to deep learning networks for understanding by non-expert users.
References
[1] Zeiler M.D., Fergus R.
(2014) Visualizing and Understanding Convolutional Networks. In: Fleet D.,
Pajdla T., Schiele B., Tuytelaars T. (eds) Computer Vision – ECCV 2014. ECCV
2014. Lecture Notes in Computer Science, vol 8689. Springer, Cham. https://doi.org/10.1007/978-3-319-10590-1_53
[2] Elzen, van den, S. J., & Wijk, van, J. J. (2011). BaobabView: Interactive construction and analysis of decision trees. In Proceedings
IEEE Symposium on Visual Analytics Science and Technology (VAST 2011,
Providence, RI, USA, October 23-28, 2011) (blz. 151-160). Institute of Electrical and Electronics Engineers. https://doi.org/10.1109/VAST.2011.6102453
Links
·
https://playground.tensorflow.org/
·
https://research.tue.nl/files/47014509/715241-1.pdf
Details
- Student
-
XZXin Zhao
- Supervisor
-
 Stef van den Elzen
- Link
- Thesis