Project: Visualization and layout of architecture/design diagrams {using UML}
Description
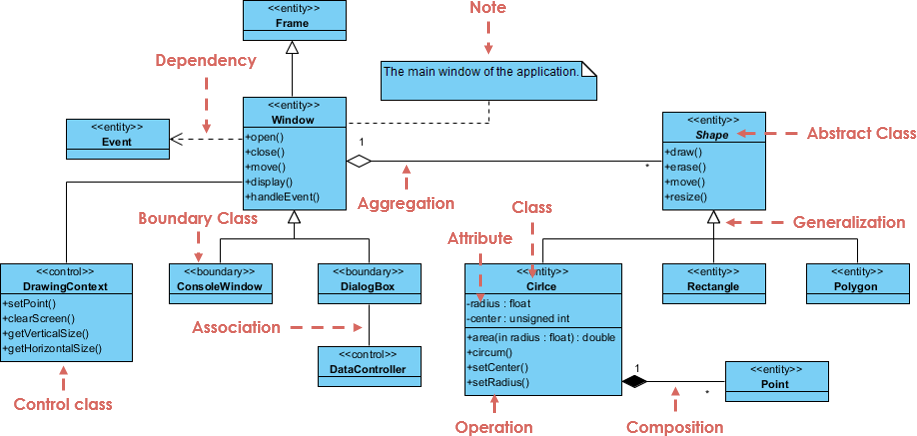
In software
engineering Unified Modeling Language (UML) diagrams are used to visually
represent a software system. UML diagrams communicate different aspects of the
system (e.g., the main actors, roles, actions, and classes). The goal of the
UML diagram is to document the architecture of the system for better
understanding, reasoning, and maintainability. Typically a UML diagram is
visualized using blocks and arrow between the blocks (see example Figure
above). Many elements are involved and the diagrams can become quite large. A
good layout of these diagrams helps in readability and understanding. Central
elements can for example be placed at the center, and semantically similar
elements can be grouped to improve readability. Currently, there are no algorithms,
tools or techniques to automatically layout and visualize a UML diagram that
take into account such metrics. In previous research, algorithms have been developed to classify
the quality of some 90 000 UML diagrams from open-source projects [1].
Different projects
related to visualization of UML diagrams are possible:
·
Automatic layout. In this project we explore the different
quality metrics and use them to visualize UML diagrams. The goal is to create a
tool/technique to visualize UML diagrams with automatic layouting and
interaction techniques for exploration and analysis. Likely, the quality
metrics as identified earlier can be used to create a semantically meaningful
layout.
One possible direction is to use machine learning techniques to tailor parameters
in the layout-algorithm.
·
Source code UML diagram generation. Can UML diagrams automatically be generated
from code? This would save valuable time if no UML diagram is designed before
coding the software and helps in understanding the architecture and system.
Second it can be used to compare the ‘offline’ UML diagram to the automatically
generated one for conformance checking and to understand differences.
·
Dependency evolution. Typically, software evolves over time.
Different UML diagrams constructed at milestone moments, help in understanding
the evolution of the software. Currently no visualization methods exist for the
exploration and analysis of evolving UML diagrams. The goal of this project is
to develop tools & techniques to visualize the evolution of UML diagrams.
·
Details
- Supervisor
-
 Stef van den Elzen
- Secondary supervisor
-
MCprof.dr. Michel Chaudron
- External location
- Internal