Project: Visualization of Oblique Decision Trees for Model Explainability
Description

A surrogate model is an
interpretable model trained to approximate the predictions of a black box model
for model explainability[1]. Thus
it should be able to approximate the predictions of the underlying model as
accurately as possible and be interpretable at the same time. The decision tree
model is widely used as a surrogate model since it can be easily trained and
interpreted. The traditional decision tree model uses an axis-parallel split
point to determine whether a data point should be assigned to the left or right
branch. However, it requires many splits to achieve the approximation accuracy when
decision boundaries are oblique, and, therefore, increases the interpretation
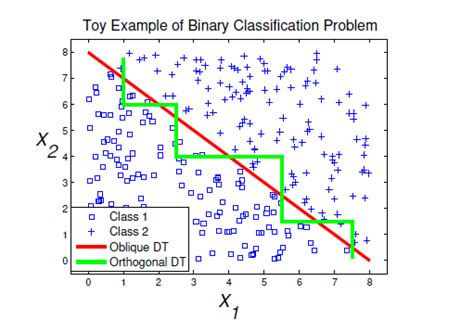
difficulty. By contrast, oblique decision trees have the potential to
outperform traditional decision trees because with a smaller number of splits
an oblique hyperplane can achieve better separation of the instances of the data
that belong to different classes[2], as
shown in Fig. 1. However considering that the oblique decision rules are less
intuitive, it is a question whether oblique rules provided in a visual
analytics context would be a good way to facilitate the explainability compared
to more common decision tree options[4].
In
this project, we want to use visualization to facilitate the explainability of
the oblique decision tree. We will compare oblique decision trees in relation
to traditional decision trees in the approximation accuracy as a surrogate
model.
References
[1]. Molnar, Christoph.“Interpretable machine learning. A Guide for Making Black Box ModelsExplainable”, 2019. https://christophm.github.io/interpretable-ml-book/global.html
[2]. Chaturvedi, Setu, and Sonal Patil."Oblique Decision Tree Learning Approaches-A Critical Review."International Journal of Computer Applications 82.13 (2013).
[3]. L. Zhang, J. Varadarajan, P. N. Suganthan, N.
Ahuja and P. Moulin, "Robust Visual Tracking Using Oblique Random
Forests," 2017 IEEE Conference on Computer Vision and Pattern Recognition
(CVPR), 2017, pp. 5825-5834, doi: 10.1109/CVPR.2017.617.
[4]. S. van den Elzen and J. J. van
Wijk, "BaobabView: Interactive construction and analysis of decision
trees," 2011 IEEE Conference on Visual Analytics Science and Technology
(VAST), 2011, pp. 151-160, doi: 10.1109/VAST.2011.6102453.
Details
- Student
-
CLChicheng Liu
- Supervisor
-
 Anna Vilanova
- Secondary supervisor
-
LCLinhao Meng, Dennis Collaris
- Link
- Thesis