Project: A processing and visualization framework to interpret X-Ray fluorescence (XRF) mapping data on Vincent van Gogh’s paintings
Description
ASML and the Van Gogh Museum entered in a partnership aimed at supporting the preservation of Vincent van Gogh’s legacy. Understanding the objects, context and materials, how they have changed and will change in the future, and how that change can be monitored and mitigated are some of the research avenues being pursued. Virtual (un)ageing has allowed researchers and the public to reimagine Van Gogh’s paintings as they were freshly painted but also as they may look like in the future if colors continue to fade. Digital reconstructions rely on historical documentation and testimony combined with visual and chemical information on the paintings and paint reconstructions into predictive computational models.
X-Ray fluorescence mapping is a technique that provides the distribution of chemical elements of the top and sublayers of the painting and thus on the composition of the paints and nature of the pigments. The data obtained from the XRF scans is high-dimensional, and requires special solutions in order to extract information that is interpretable. Visual Analytics for spatially resolved high-dimensional data could facilitate the understanding and provide ways to generate hypothesis. The purpose of this project is to create visual analytics framework that includes algorithms that are used to process XRF scanning raw data and visualization solutions and interaction for elemental, pigment or paint distribution across the painting. Techniques like dimensionality reduction for interactive exploration of multi-dimentional data [3] is a promising direction to be adapted to XRF data and pigment evolution [4].
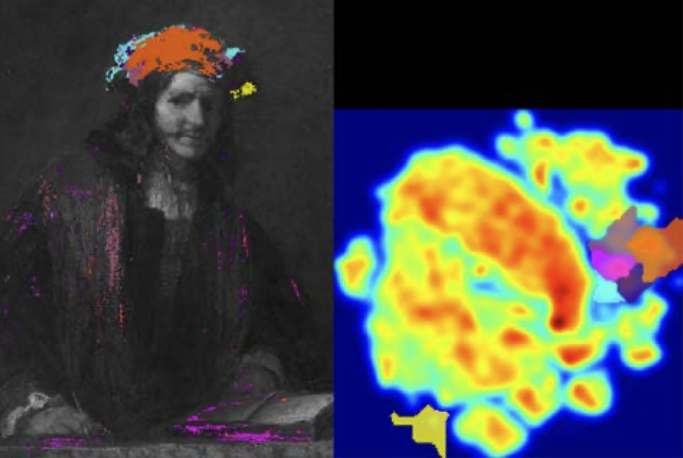
Figure: Example of a visual analytics framework showing XRF maps and the correlation between pigment composition across different area of the painting[4].
Deliverables
- A visual analytics framework for users to upload and process raw XRF scanning data and to visually analyze elemental, pigment or paint distribution maps
References
- Kirchner E, van der Lans I, Ligterink F, Geldof M, Megens L, Meedendorp T, et al. Digitally reconstructing Van Gogh’s Field with Irises near Arles part 3: Determining the original colors. Color Research & Application. 2018 Jun 1;43(3):311–27.
- Dik J, Janssens K, Van Der Snickt G, van der Loeff L, Rickers K, Cotte M. Visualization of a Lost Painting by Vincent van Gogh Using Synchrotron Radiation Based X-ray Fluorescence Elemental Mapping. Anal Chem. 2008 Aug;80(16):6436–42.
- Höllt, T., Vilanova, A., Pezzotti, N., Lelieveldt, B. and Hauser, H. (2019), Focus+Context Exploration of Hierarchical Embeddings. Computer Graphics Forum, 38: 569-579. https://doi.org/10.1111/cgf.13711
- Matthias Alfeld, Joan Belder, Barend Thijsse, Joris Dik, Thomas Höllt, Anna Vilanova and Robert Erdmann, Sorting the Palettes of Rembrandt – Three New Approaches to Cluster MA-XRF Data. Abstract MA-XRF scanning in Conservation, Art and Archeology Catania, October, 15-16, 2019
Details
- Student
-
DBDominique van Berkum
- Supervisor
-
 Anna Vilanova
- Secondary supervisor
-
AMAna Martins (van Gogh Museum) and Lars Maxfield (ASML)
- External location
- ASML
- Link
- Thesis