back to list

Project: Reverse Engineering and visualization of micro-service based architectures based on execution traces
Description

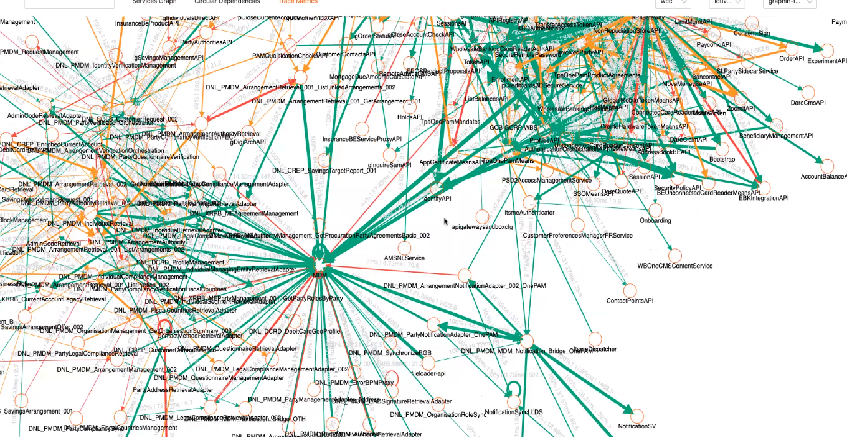
This is a project with ING Bank (Amsterdam*). ING wants to better understand their micro-service architecture. They reconstruct this based on execution traces. This leads to very large graphs (see example). The project may involve one or more of the following:
o Analysis & Visualisation of ‘design smells/anti-patterns’ in their microservice architecture
o Analysis & Visualisation of performance and/or reliability bottlenecks
o Create interactive visualisations that allow for various types of filtering, slicing, summarization.
Details
- Student
-
JPJoris Peters
- Supervisor
-
 Stef van den Elzen
- Secondary supervisor
-
MCprof.dr. Michel Chaudron
- External location
- ING Amsterdam
- Link
- Thesis